
- Startseite >
- Flüsse >
- Wasserstand >
- Regnitz >
- Illesheim >
- Jahresgrafik

Jahresgrafik Illesheim / Aisch
Wasserstand vom 31.07.2022 bis zum 30.07.2023
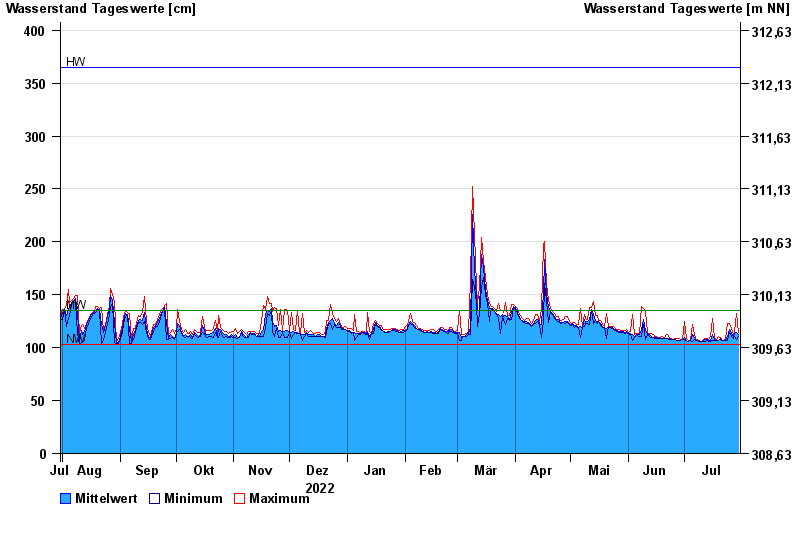
Hinweis
Wasserstand und Abfluss wird zeitweise durch Biberdamm beeinflusst.
| Datum | Mittelwert [cm] | Maximum [cm] | Minimum [cm] |
|---|---|---|---|
| 30.07.2023 | 112 | 114 | 111 |
| 29.07.2023 | 114 | 132 | 108 |
| 28.07.2023 | 113 | 115 | 111 |
| 27.07.2023 | 110 | 112 | 109 |
| 26.07.2023 | 113 | 118 | 111 |
| 25.07.2023 | 117 | 123 | 114 |
| 24.07.2023 | 111 | 123 | 107 |
© Bayerisches Landesamt für Umwelt 2024