
- Startseite >
- Flüsse >
- Wasserstand >
- Regnitz >
- Illesheim >
- Jahresgrafik

Jahresgrafik Illesheim / Aisch
Wasserstand vom 24.09.2020 bis zum 23.09.2021
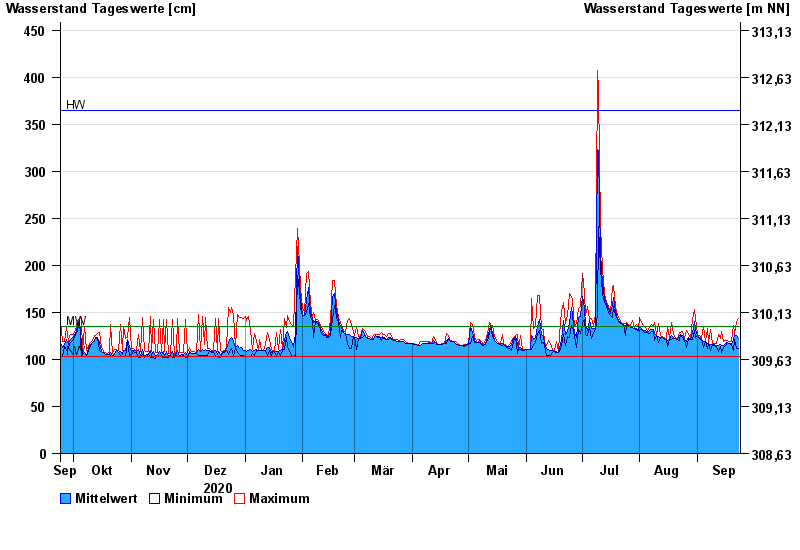
Hinweis
Wasserstand und Abfluss wird zeitweise durch Biberdamm beeinflusst.
| Datum | Mittelwert [cm] | Maximum [cm] | Minimum [cm] |
|---|---|---|---|
| 23.09.2021 | 122 | 143 | 112 |
| 22.09.2021 | 125 | 139 | 112 |
| 21.09.2021 | 126 | 128 | 121 |
| 20.09.2021 | 120 | 136 | 109 |
| 19.09.2021 | 117 | 119 | 116 |
| 18.09.2021 | 117 | 119 | 117 |
| 17.09.2021 | 118 | 120 | 118 |
© Bayerisches Landesamt für Umwelt 2024