
- Startseite >
- Flüsse >
- Wasserstand >
- Regnitz >
- Erlangen >
- Jahresgrafik

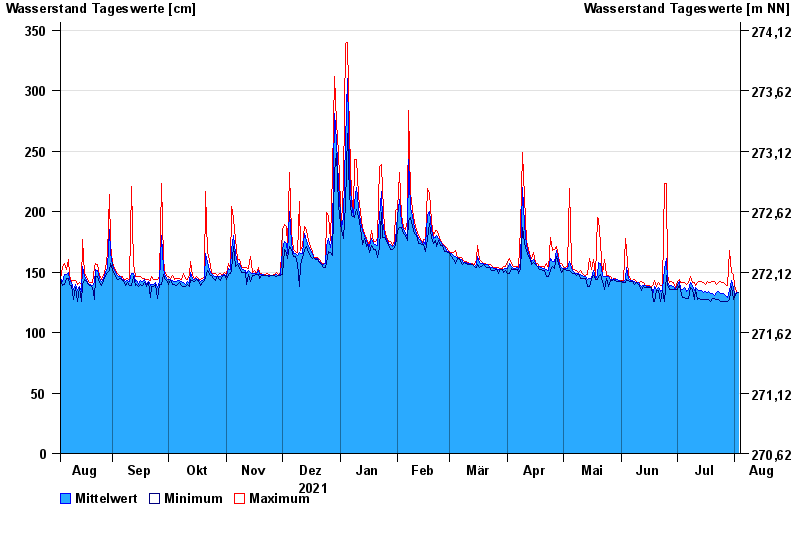
Jahresgrafik Erlangen / Schwabach
Wasserstand vom 04.08.2021 bis zum 03.08.2022
- 29.07.1941 Wasserstand: 524 cm
- 26.01.1995 Wasserstand: 481 cm
- 21.12.1993 Wasserstand: 445 cm
- 23.02.1970 Wasserstand: 443 cm
- 20.07.2011 Wasserstand: 438 cm
| Datum | Mittelwert [cm] | Maximum [cm] | Minimum [cm] |
|---|---|---|---|
| 03.08.2022 | 133 | 133 | 133 |
| 02.08.2022 | 133 | 134 | 132 |
| 01.08.2022 | 131 | 139 | 129 |
| 31.07.2022 | 137 | 148 | 127 |
| 30.07.2022 | 143 | 150 | 138 |
| 29.07.2022 | 135 | 168 | 127 |
| 28.07.2022 | 129 | 139 | 126 |
© Bayerisches Landesamt für Umwelt 2024