
- Startseite >
- Flüsse >
- Wasserstand >
- Regnitz >
- Emskirchen >
- Jahresgrafik

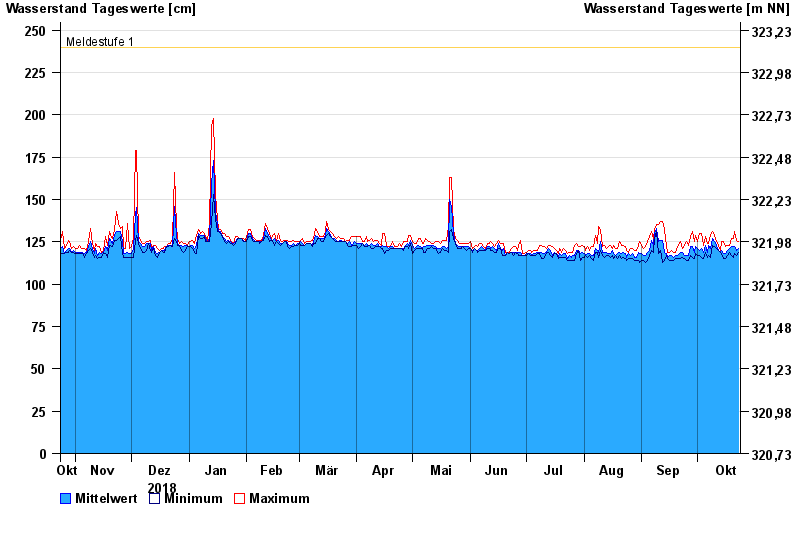
Jahresgrafik Emskirchen / Mittlere Aurach
Wasserstand vom 24.10.2018 bis zum 23.10.2019
Hinweis
Wasserstand und Abfluss wird zeitweise durch Biberdamm beeinflusst.
- Meldestufe 1 240 cm
- Meldestufe 2 270 cm
- Meldestufe 3 290 cm
- Meldestufe 4 330 cm
- Hochwassergefahrenfläche HQ100 340 cm
| Datum | Mittelwert [cm] | Maximum [cm] | Minimum [cm] |
|---|---|---|---|
| 23.10.2019 | 121 | 125 | 119 |
| 22.10.2019 | 120 | 126 | 117 |
| 21.10.2019 | 122 | 131 | 118 |
| 20.10.2019 | 122 | 127 | 116 |
| 19.10.2019 | 122 | 127 | 117 |
| 18.10.2019 | 121 | 123 | 119 |
| 17.10.2019 | 120 | 123 | 117 |
© Bayerisches Landesamt für Umwelt 2024