
- Startseite >
- Flüsse >
- Wasserstand >
- Regnitz >
- Büg >
- Jahresgrafik

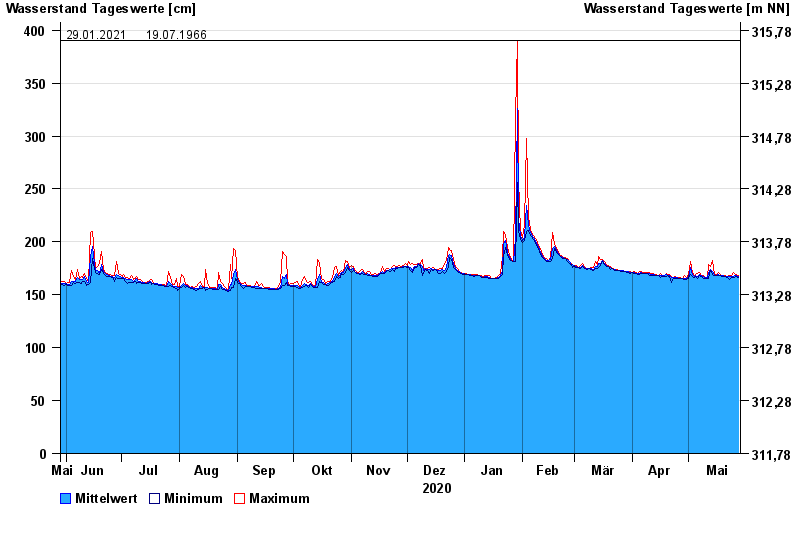
Jahresgrafik Büg / Schwabach
Wasserstand vom 29.05.2020 bis zum 28.05.2021
- 20.07.2011 Wasserstand: 409 cm
- 28.10.1998 Wasserstand: 404 cm
- 26.01.1995 Wasserstand: 401 cm
- 29.01.2021 Wasserstand: 390 cm
- 19.07.1966 Wasserstand: 390 cm
| Datum | Mittelwert [cm] | Maximum [cm] | Minimum [cm] |
|---|---|---|---|
| 28.05.2021 | 167 | 168 | 166 |
| 27.05.2021 | 168 | 169 | 167 |
| 26.05.2021 | 168 | 170 | 166 |
| 25.05.2021 | 167 | 171 | 166 |
| 24.05.2021 | 167 | 168 | 166 |
| 23.05.2021 | 167 | 168 | 164 |
| 22.05.2021 | 167 | 167 | 166 |
© Bayerisches Landesamt für Umwelt 2024