
- Startseite >
- Flüsse >
- Wasserstand >
- Regnitz >
- Aha >
- Jahresgrafik

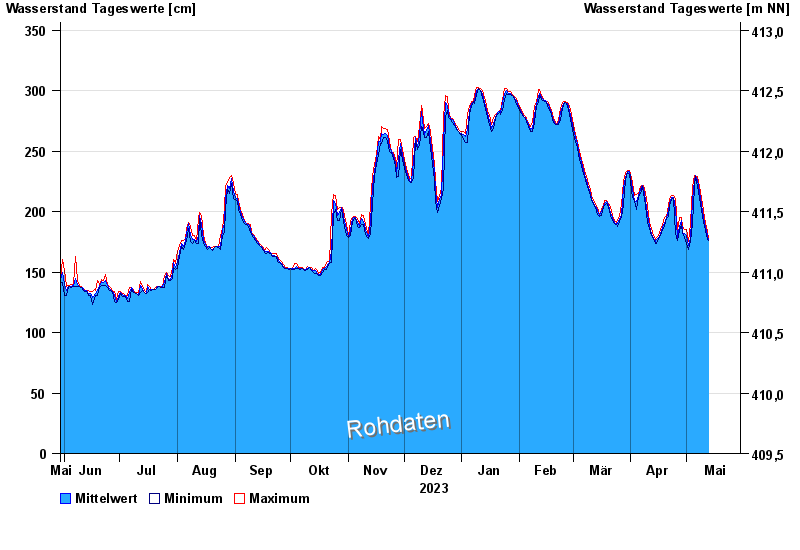
Jahresgrafik Aha / Altmühl
Wasserstand vom 30.05.2023 bis zum 29.05.2024
- 17.03.1988 Wasserstand: 379 cm
- 14.04.1994 Wasserstand: 373 cm
- 01.02.1982 Wasserstand: 373 cm
- 21.12.1993 Wasserstand: 371 cm
- 03.03.1987 Wasserstand: 361 cm
| Datum | Mittelwert [cm] | Maximum [cm] | Minimum [cm] |
|---|---|---|---|
| 28.04.2024 | 194 | 195 | 193 |
| 27.04.2024 | 188 | 195 | 184 |
| 26.04.2024 | 179 | 184 | 176 |
| 25.04.2024 | 202 | 211 | 182 |
| 24.04.2024 | 212 | 213 | 211 |
| 23.04.2024 | 212 | 213 | 210 |
| 22.04.2024 | 207 | 210 | 205 |
© Bayerisches Landesamt für Umwelt 2024