
- Startseite >
- Flüsse >
- Wasserstand >
- Regnitz >
- Aha >
- Jahresgrafik

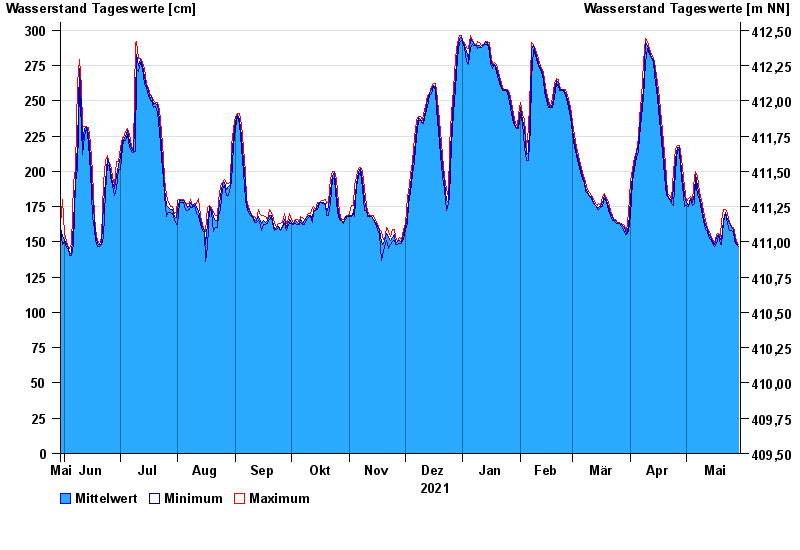
Jahresgrafik Aha / Altmühl
Wasserstand vom 30.05.2021 bis zum 29.05.2022
- 17.03.1988 Wasserstand: 379 cm
- 14.04.1994 Wasserstand: 373 cm
- 01.02.1982 Wasserstand: 373 cm
- 21.12.1993 Wasserstand: 371 cm
- 03.03.1987 Wasserstand: 361 cm
| Datum | Mittelwert [cm] | Maximum [cm] | Minimum [cm] |
|---|---|---|---|
| 29.05.2022 | 147 | 148 | 147 |
| 28.05.2022 | 149 | 150 | 148 |
| 27.05.2022 | 154 | 157 | 150 |
| 26.05.2022 | 159 | 160 | 157 |
| 25.05.2022 | 160 | 161 | 158 |
| 24.05.2022 | 163 | 164 | 158 |
| 23.05.2022 | 166 | 170 | 163 |
© Bayerisches Landesamt für Umwelt 2024