
- Startseite >
- Flüsse >
- Wasserstand >
- Untere Donau >
- Viechtach Reibenmühle >
- Jahresgrafik

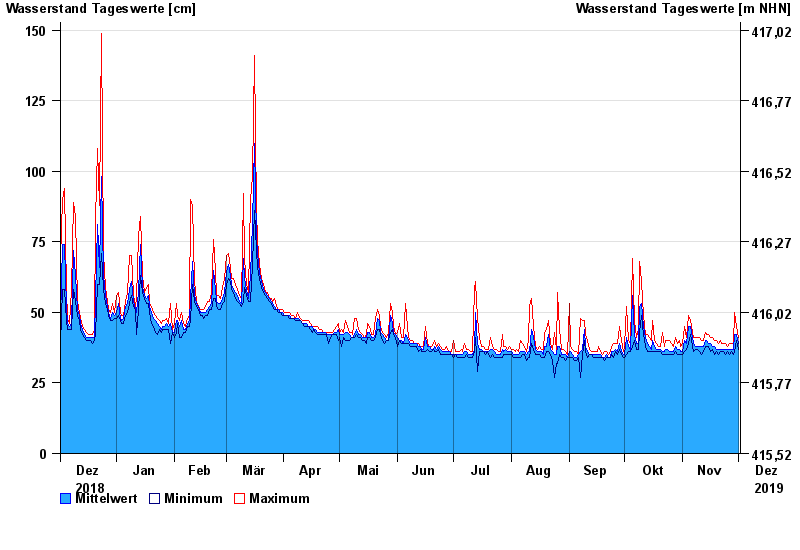
Jahresgrafik Viechtach Reibenmühle / Aitnach
Wasserstand vom 02.12.2018 bis zum 01.12.2019
| Datum | Mittelwert [cm] | Maximum [cm] | Minimum [cm] |
|---|---|---|---|
| 01.12.2019 | 39 | 41 | 37 |
| 30.11.2019 | 42 | 45 | 40 |
| 29.11.2019 | 42 | 50 | 36 |
| 28.11.2019 | 37 | 39 | 35 |
| 27.11.2019 | 37 | 39 | 36 |
| 26.11.2019 | 37 | 39 | 35 |
| 25.11.2019 | 37 | 38 | 36 |
© Bayerisches Landesamt für Umwelt 2024