
- Startseite >
- Flüsse >
- Wasserstand >
- Untere Donau >
- Viechtach Reibenmühle >
- Jahresgrafik

Jahresgrafik Viechtach Reibenmühle / Aitnach
Wasserstand vom 21.04.2024 bis zum 20.04.2025
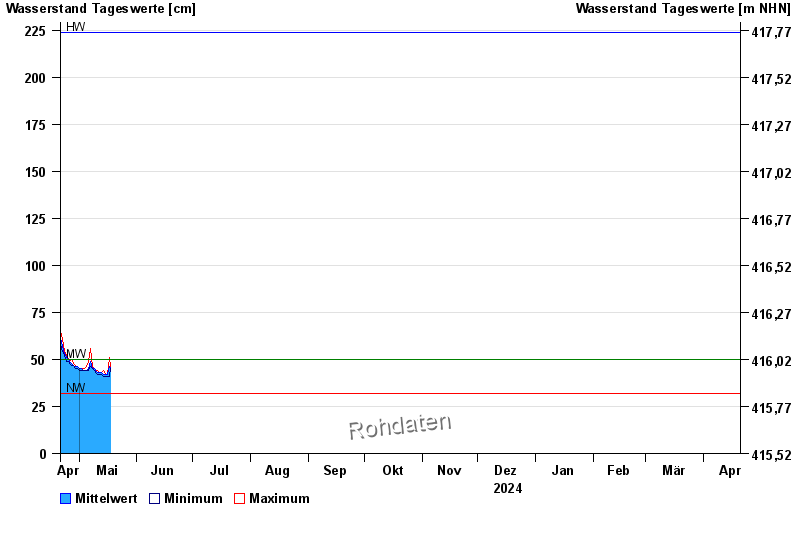
| Datum | Mittelwert [cm] | Maximum [cm] | Minimum [cm] |
|---|---|---|---|
| 15.06.2024 | 50 | 51 | 48 |
| 14.06.2024 | 50 | 51 | 48 |
| 13.06.2024 | 52 | 56 | 49 |
| 12.06.2024 | 52 | 53 | 50 |
| 11.06.2024 | 54 | 56 | 52 |
| 10.06.2024 | 59 | 63 | 55 |
| 09.06.2024 | 54 | 57 | 53 |
© Bayerisches Landesamt für Umwelt 2024