
- Startseite >
- Flüsse >
- Wasserstand >
- Untere Donau >
- Teisnach >
- Jahresgrafik

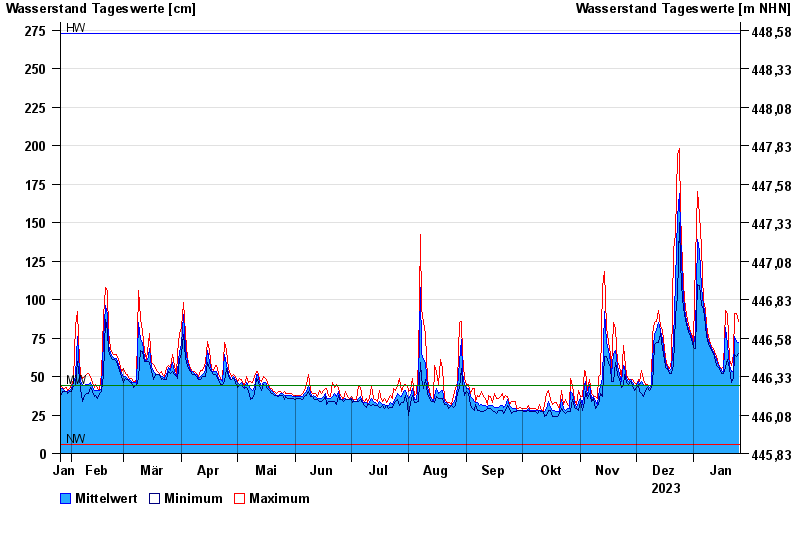
Jahresgrafik Teisnach / Schwarzer Regen
Wasserstand vom 26.01.2023 bis zum 25.01.2024
| Datum | Mittelwert [cm] | Maximum [cm] | Minimum [cm] |
|---|---|---|---|
| 25.01.2024 | 72 | 86 | 65 |
| 24.01.2024 | 73 | 91 | 63 |
| 23.01.2024 | 76 | 91 | 64 |
| 22.01.2024 | 53 | 64 | 49 |
| 21.01.2024 | 53 | 57 | 46 |
| 20.01.2024 | 57 | 61 | 55 |
| 19.01.2024 | 71 | 91 | 61 |
© Bayerisches Landesamt für Umwelt 2024