
- Startseite >
- Flüsse >
- Wasserstand >
- Untere Donau >
- Seebruck >
- Jahresgrafik

Jahresgrafik Seebruck / Alz
Wasserstand vom 30.03.2024 bis zum 29.03.2025
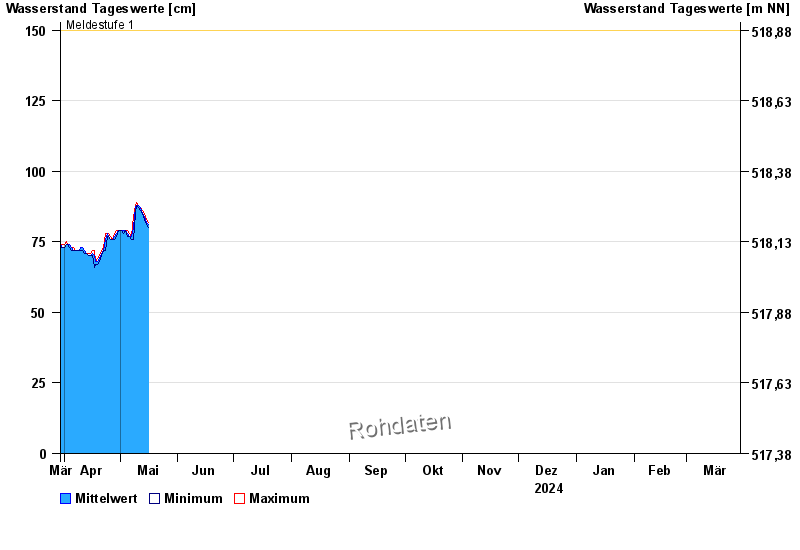
- Meldestufe 1 150 cm
- Meldestufe 2 180 cm
- Meldestufe 3 220 cm
- Meldestufe 4 240 cm
- Hochwassergefahrenfläche HQ100 260 cm
| Datum | Mittelwert [cm] | Maximum [cm] | Minimum [cm] |
|---|---|---|---|
| 31.05.2024 | 79 | 81 | 77 |
| 30.05.2024 | 77 | 77 | 76 |
| 29.05.2024 | 77 | 77 | 76 |
| 28.05.2024 | 76 | 77 | 75 |
| 27.05.2024 | 75 | 75 | 74 |
| 26.05.2024 | 76 | 76 | 75 |
| 25.05.2024 | 76 | 77 | 76 |
© Bayerisches Landesamt für Umwelt 2024