
- Startseite >
- Flüsse >
- Wasserstand >
- Untere Donau >
- Seebruck >
- Jahresgrafik

Jahresgrafik Seebruck / Alz
Wasserstand vom 17.02.2019 bis zum 16.02.2020
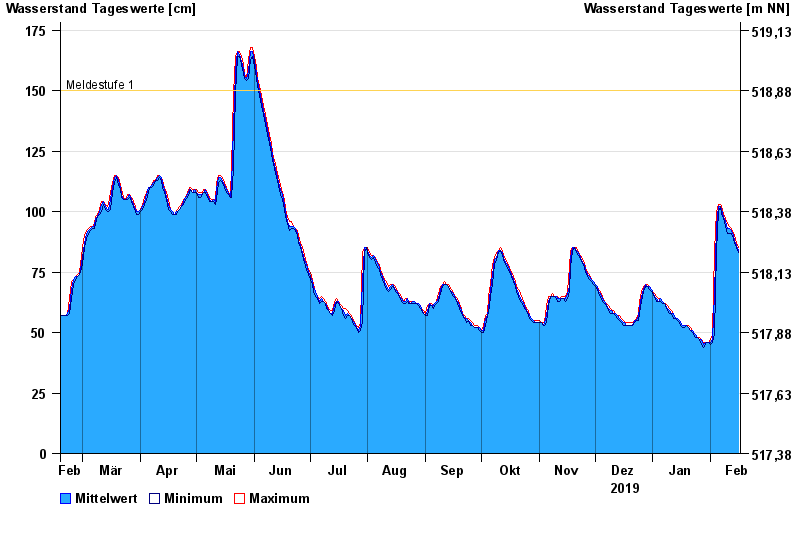
- Meldestufe 1 150 cm
- Meldestufe 2 180 cm
- Meldestufe 3 220 cm
- Meldestufe 4 240 cm
- Hochwassergefahrenfläche HQ100 260 cm
| Datum | Mittelwert [cm] | Maximum [cm] | Minimum [cm] |
|---|---|---|---|
| 16.02.2020 | 84 | 85 | 83 |
| 15.02.2020 | 86 | 87 | 85 |
| 14.02.2020 | 88 | 90 | 87 |
| 13.02.2020 | 90 | 91 | 89 |
| 12.02.2020 | 92 | 93 | 91 |
| 11.02.2020 | 93 | 94 | 91 |
| 10.02.2020 | 93 | 95 | 91 |
© Bayerisches Landesamt für Umwelt 2024