
- Startseite >
- Flüsse >
- Wasserstand >
- Untere Donau >
- Schwabelweis >
- Jahresgrafik

Jahresgrafik Schwabelweis / Donau
Wasserstand vom 29.03.2024 bis zum 28.03.2025
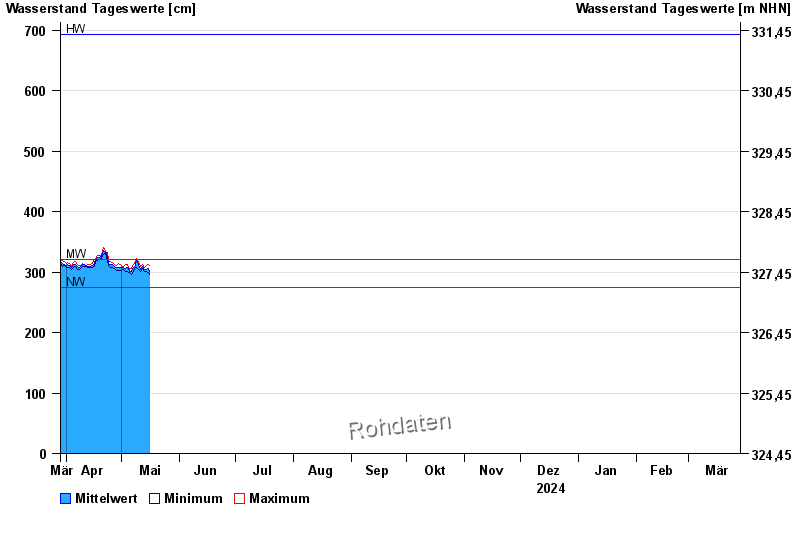
| Datum | Mittelwert [cm] | Maximum [cm] | Minimum [cm] |
|---|---|---|---|
| 16.05.2024 | 299 | 301 | 296 |
| 15.05.2024 | 306 | 313 | 300 |
| 14.05.2024 | 305 | 311 | 301 |
| 13.05.2024 | 304 | 308 | 301 |
| 12.05.2024 | 310 | 313 | 306 |
| 11.05.2024 | 305 | 309 | 301 |
| 10.05.2024 | 312 | 317 | 305 |
© Bayerisches Landesamt für Umwelt 2024