
- Startseite >
- Flüsse >
- Wasserstand >
- Untere Donau >
- Schwabelweis >
- Jahresgrafik

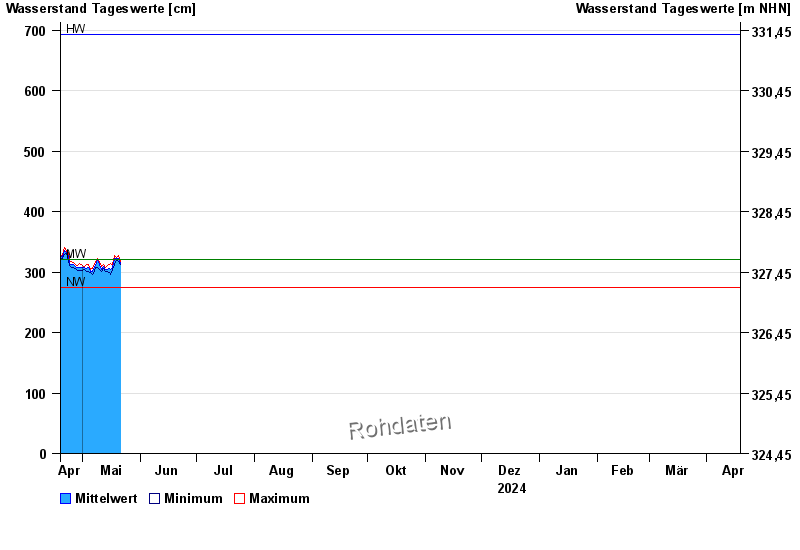
Jahresgrafik Schwabelweis / Donau
Wasserstand vom 19.04.2024 bis zum 18.04.2025
| Datum | Mittelwert [cm] | Maximum [cm] | Minimum [cm] |
|---|---|---|---|
| 15.06.2024 | 364 | 364 | 364 |
| 14.06.2024 | 371 | 377 | 364 |
| 13.06.2024 | 388 | 402 | 378 |
| 12.06.2024 | 417 | 437 | 402 |
| 11.06.2024 | 448 | 454 | 438 |
| 10.06.2024 | 442 | 445 | 439 |
| 09.06.2024 | 454 | 470 | 445 |
© Bayerisches Landesamt für Umwelt 2024