
- Startseite >
- Flüsse >
- Wasserstand >
- Untere Donau >
- Schönach >
- Jahresgrafik

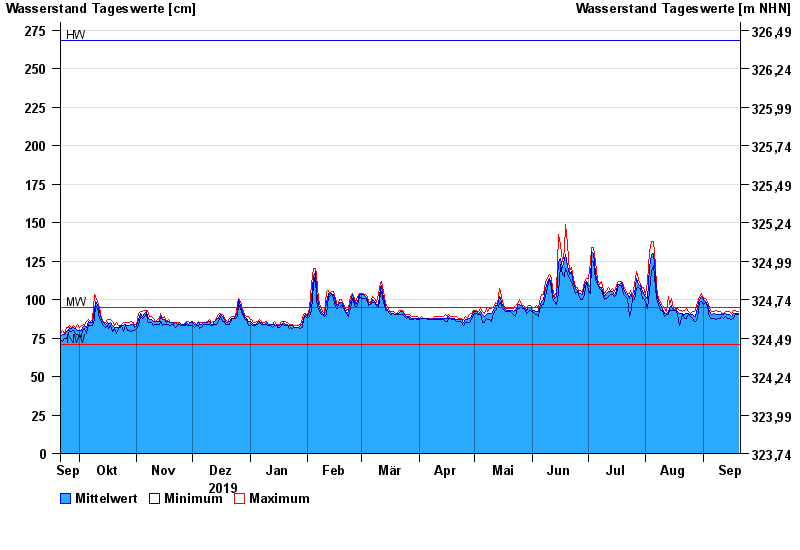
Jahresgrafik Schönach / Große Laber
Wasserstand vom 21.09.2019 bis zum 20.09.2020
| Datum | Mittelwert [cm] | Maximum [cm] | Minimum [cm] |
|---|---|---|---|
| 20.09.2020 | 91 | 92 | 90 |
| 19.09.2020 | 91 | 92 | 90 |
| 18.09.2020 | 91 | 93 | 90 |
| 17.09.2020 | 91 | 93 | 88 |
| 16.09.2020 | 89 | 91 | 87 |
| 15.09.2020 | 90 | 92 | 88 |
| 14.09.2020 | 90 | 92 | 88 |
© Bayerisches Landesamt für Umwelt 2024