
- Startseite >
- Flüsse >
- Wasserstand >
- Untere Donau >
- Schönach >
- Jahresgrafik

Jahresgrafik Schönach / Große Laber
Wasserstand vom 23.02.2020 bis zum 22.02.2021
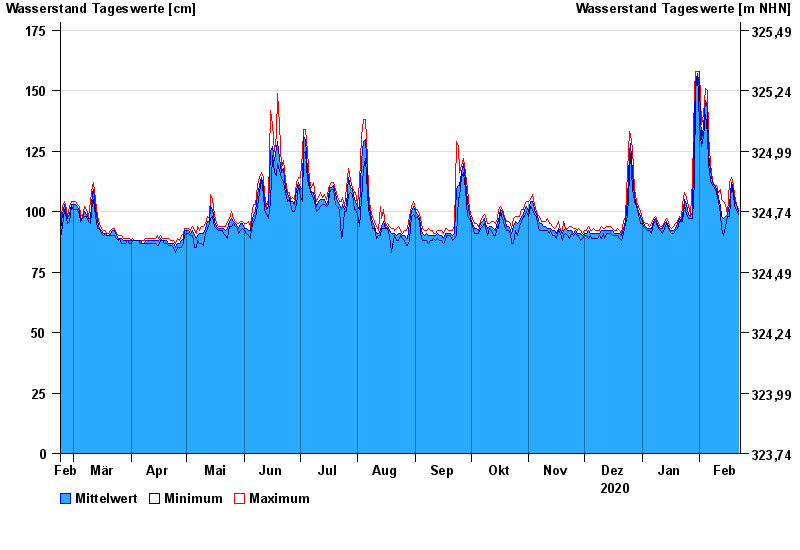
- Hochwassergefahrenfläche HQ100 370 cm
| Datum | Mittelwert [cm] | Maximum [cm] | Minimum [cm] |
|---|---|---|---|
| 22.02.2021 | 100 | 101 | 99 |
| 21.02.2021 | 103 | 103 | 101 |
| 20.02.2021 | 104 | 107 | 102 |
| 19.02.2021 | 109 | 111 | 107 |
| 18.02.2021 | 112 | 114 | 111 |
| 17.02.2021 | 103 | 112 | 98 |
| 16.02.2021 | 99 | 99 | 98 |
© Bayerisches Landesamt für Umwelt 2024