
- Startseite >
- Flüsse >
- Wasserstand >
- Untere Donau >
- Ruhstorf >
- Jahresgrafik

Jahresgrafik Ruhstorf / Rott
Wasserstand vom 18.04.2020 bis zum 17.04.2021
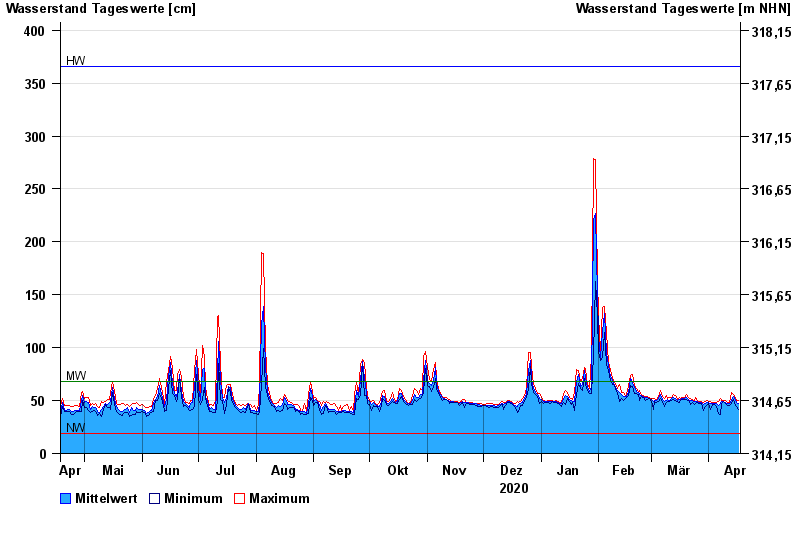
| Datum | Mittelwert [cm] | Maximum [cm] | Minimum [cm] |
|---|---|---|---|
| 17.04.2021 | 47 | 50 | 42 |
| 16.04.2021 | 48 | 50 | 44 |
| 15.04.2021 | 52 | 55 | 47 |
| 14.04.2021 | 54 | 56 | 51 |
| 13.04.2021 | 50 | 58 | 47 |
| 12.04.2021 | 47 | 48 | 45 |
| 11.04.2021 | 47 | 48 | 45 |
© Bayerisches Landesamt für Umwelt 2024