
- Startseite >
- Flüsse >
- Wasserstand >
- Untere Donau >
- Ruhstorf >
- Jahresgrafik

Jahresgrafik Ruhstorf / Rott
Wasserstand vom 08.05.2020 bis zum 07.05.2021
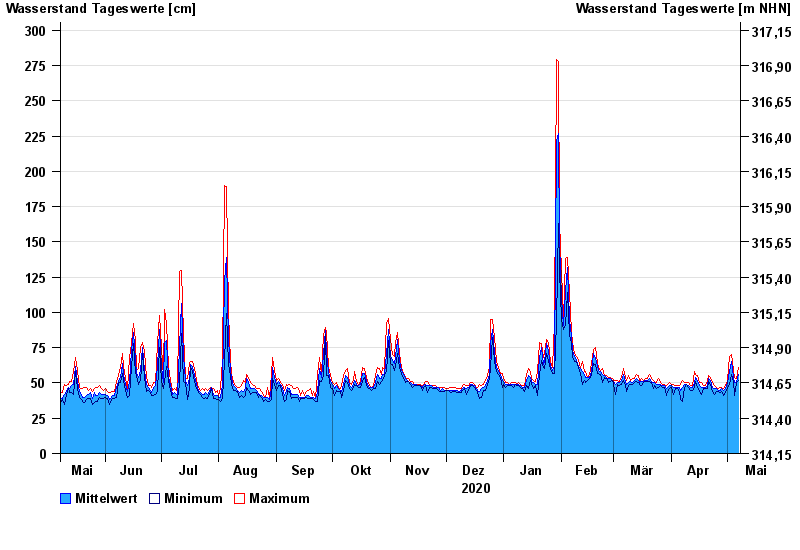
| Datum | Mittelwert [cm] | Maximum [cm] | Minimum [cm] |
|---|---|---|---|
| 07.05.2021 | 56 | 61 | 52 |
| 06.05.2021 | 50 | 53 | 50 |
| 05.05.2021 | 50 | 54 | 41 |
| 04.05.2021 | 54 | 59 | 51 |
| 03.05.2021 | 65 | 70 | 56 |
| 02.05.2021 | 58 | 69 | 49 |
| 01.05.2021 | 50 | 52 | 47 |
© Bayerisches Landesamt für Umwelt 2024