
- Startseite >
- Flüsse >
- Wasserstand >
- Untere Donau >
- Ruhstorf >
- Jahresgrafik

Jahresgrafik Ruhstorf / Rott
Wasserstand vom 13.05.2021 bis zum 12.05.2022
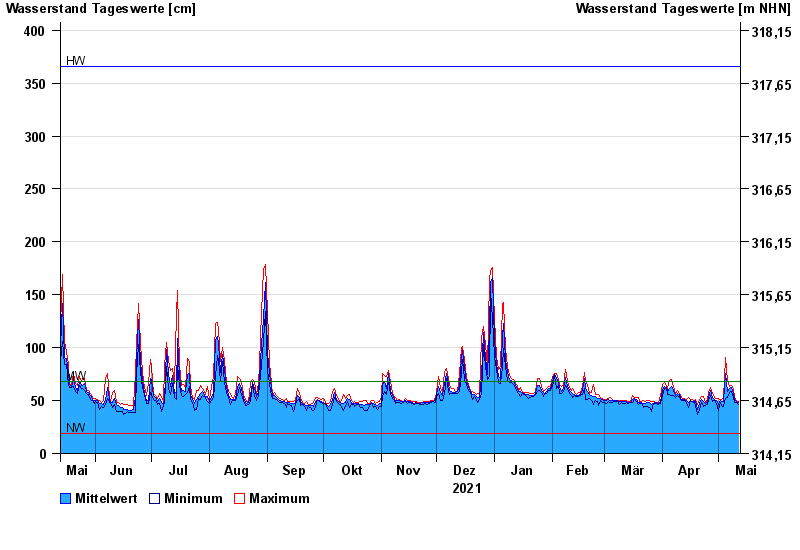
| Datum | Mittelwert [cm] | Maximum [cm] | Minimum [cm] |
|---|---|---|---|
| 12.05.2022 | 48 | 49 | 46 |
| 11.05.2022 | 49 | 50 | 48 |
| 10.05.2022 | 51 | 53 | 48 |
| 09.05.2022 | 57 | 61 | 53 |
| 08.05.2022 | 62 | 64 | 59 |
| 07.05.2022 | 61 | 63 | 58 |
| 06.05.2022 | 59 | 69 | 53 |
© Bayerisches Landesamt für Umwelt 2024