
- Startseite >
- Flüsse >
- Wasserstand >
- Untere Donau >
- Pulling >
- Monatsgrafik

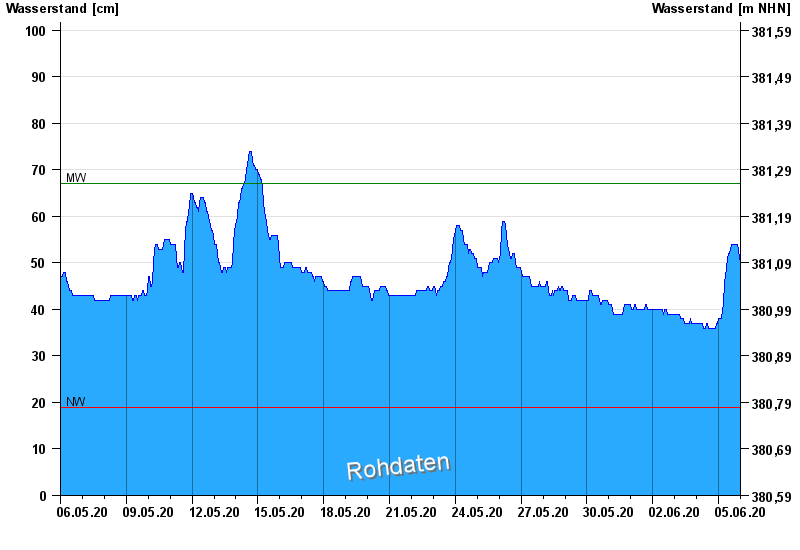
Monatsgrafik Pulling / Regen
Wasserstand vom 06.05.2020 bis zum 05.06.2020
| Datum | Wasserstand [cm] |
|---|---|
| 06.06.2020 00:45 | 48 |
| 06.06.2020 00:30 | 48 |
| 06.06.2020 00:15 | 49 |
| 06.06.2020 00:00 | 49 |
| 05.06.2020 23:45 | 49 |
| 05.06.2020 23:30 | 50 |
| 05.06.2020 23:15 | 51 |
© Bayerisches Landesamt für Umwelt 2024