
- Startseite >
- Flüsse >
- Wasserstand >
- Untere Donau >
- Pulling >
- Jahresgrafik

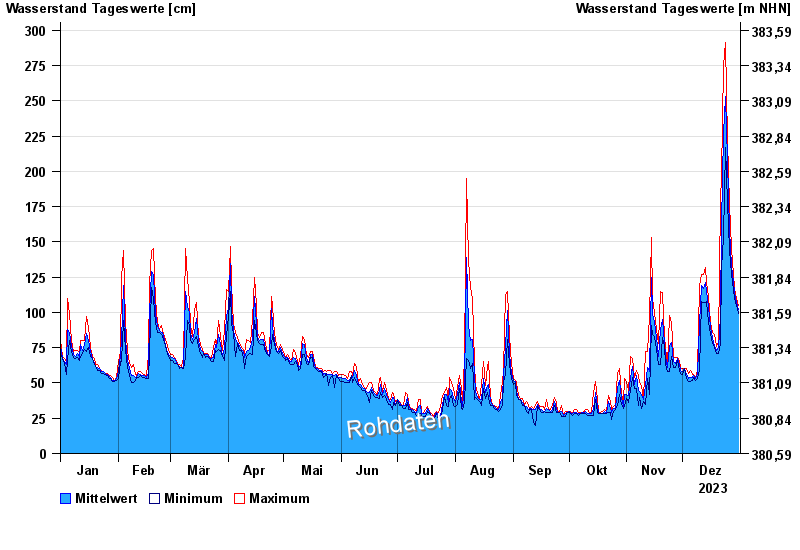
Jahresgrafik Pulling / Regen
Wasserstand vom 01.01.2023 bis zum 31.12.2023
| Datum | Mittelwert [cm] | Maximum [cm] | Minimum [cm] |
|---|---|---|---|
| 31.12.2023 | 102 | 105 | 99 |
| 30.12.2023 | 107 | 110 | 105 |
| 29.12.2023 | 114 | 117 | 110 |
| 28.12.2023 | 121 | 127 | 116 |
| 27.12.2023 | 133 | 145 | 127 |
| 26.12.2023 | 158 | 177 | 144 |
| 25.12.2023 | 208 | 222 | 178 |
© Bayerisches Landesamt für Umwelt 2024