
- Startseite >
- Flüsse >
- Wasserstand >
- Untere Donau >
- Passau Ingling >
- Jahresgrafik

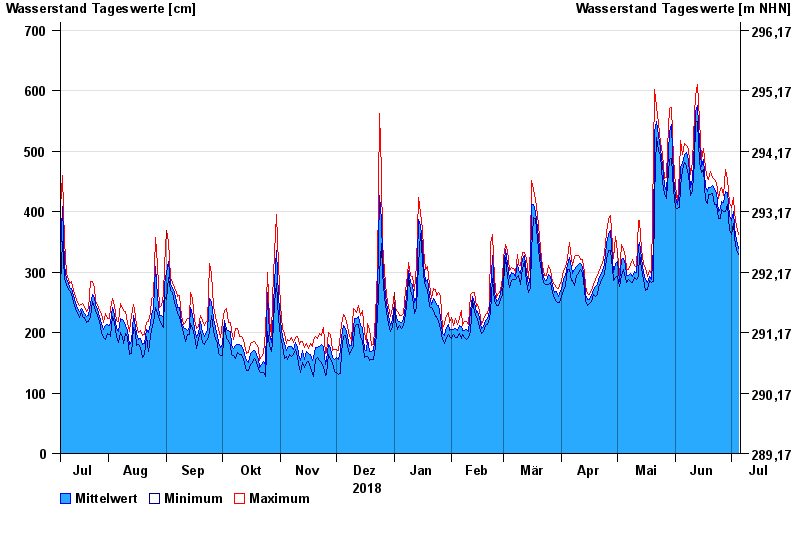
Jahresgrafik Passau Ingling / Inn
Wasserstand vom 06.07.2018 bis zum 05.07.2019
| Datum | Mittelwert [cm] | Maximum [cm] | Minimum [cm] |
|---|---|---|---|
| 05.07.2019 | 339 | 362 | 329 |
| 04.07.2019 | 352 | 375 | 336 |
| 03.07.2019 | 374 | 399 | 358 |
| 02.07.2019 | 401 | 423 | 381 |
| 01.07.2019 | 385 | 407 | 362 |
| 30.06.2019 | 393 | 415 | 369 |
| 29.06.2019 | 432 | 453 | 411 |
© Bayerisches Landesamt für Umwelt 2024