
- Startseite >
- Flüsse >
- Wasserstand >
- Untere Donau >
- Passau Ingling >
- Jahresgrafik

Jahresgrafik Passau Ingling / Inn
Wasserstand vom 06.07.2019 bis zum 05.07.2020
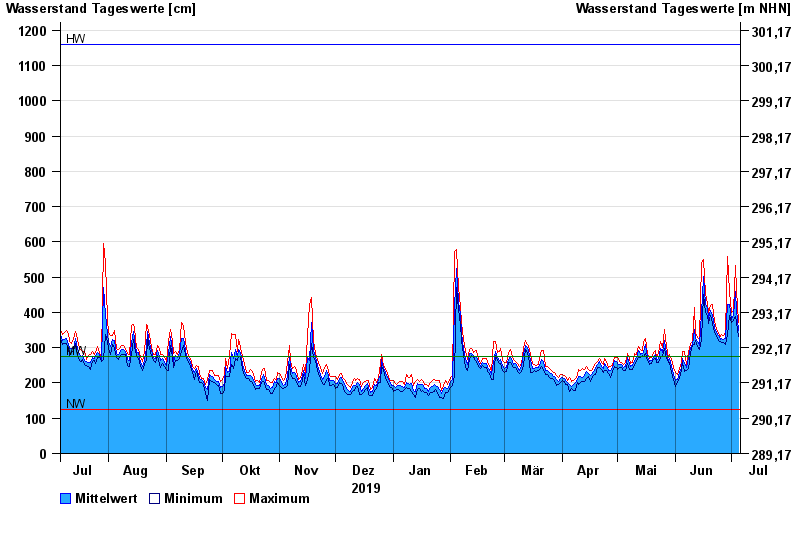
| Datum | Mittelwert [cm] | Maximum [cm] | Minimum [cm] |
|---|---|---|---|
| 05.07.2020 | 350 | 371 | 332 |
| 04.07.2020 | 404 | 462 | 371 |
| 03.07.2020 | 458 | 533 | 388 |
| 02.07.2020 | 394 | 404 | 378 |
| 01.07.2020 | 380 | 399 | 370 |
| 30.06.2020 | 423 | 459 | 390 |
| 29.06.2020 | 422 | 558 | 336 |
© Bayerisches Landesamt für Umwelt 2024