
- Startseite >
- Flüsse >
- Wasserstand >
- Untere Donau >
- Passau >
- Jahresgrafik

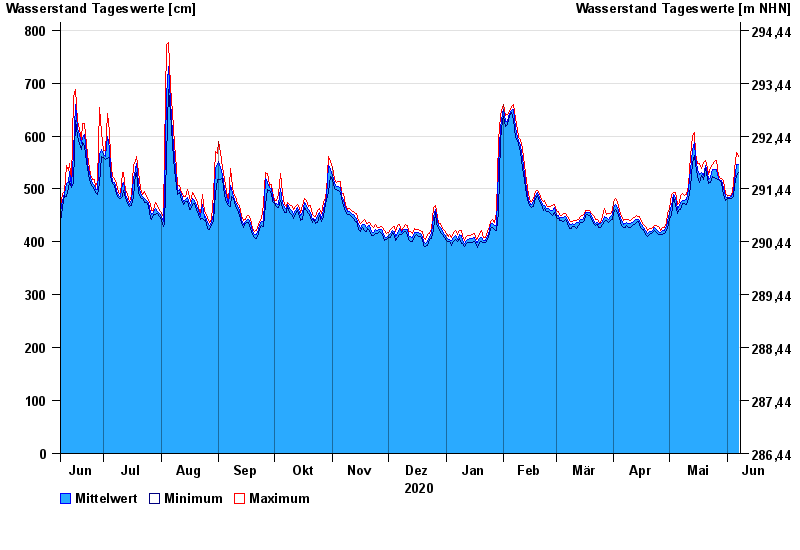
Jahresgrafik Passau / Donau
Wasserstand vom 08.06.2020 bis zum 07.06.2021
| Datum | Mittelwert [cm] | Maximum [cm] | Minimum [cm] |
|---|---|---|---|
| 07.06.2021 | 546 | 562 | 532 |
| 06.06.2021 | 547 | 568 | 525 |
| 05.06.2021 | 514 | 536 | 506 |
| 04.06.2021 | 494 | 508 | 486 |
| 03.06.2021 | 485 | 488 | 482 |
| 02.06.2021 | 484 | 487 | 482 |
| 01.06.2021 | 484 | 488 | 482 |
© Bayerisches Landesamt für Umwelt 2024