
- Startseite >
- Flüsse >
- Wasserstand >
- Untere Donau >
- Parsberg >
- Jahresgrafik

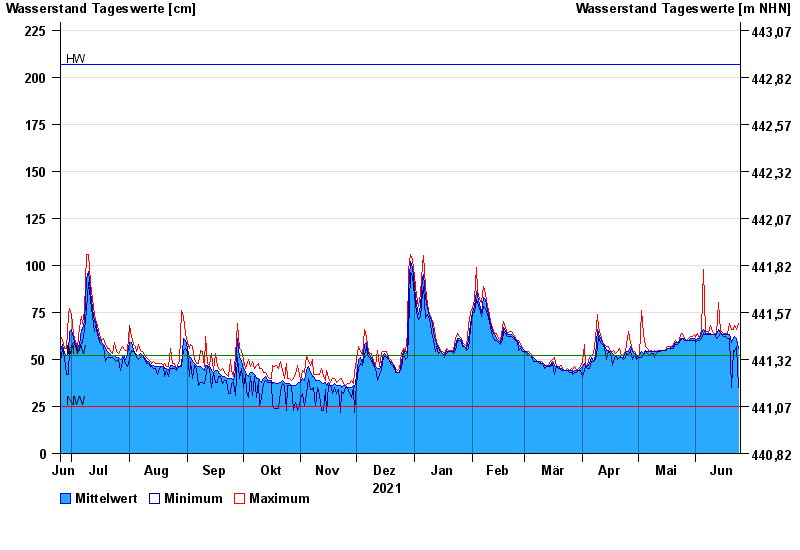
Jahresgrafik Parsberg / Schwarze Laber
Wasserstand vom 25.06.2021 bis zum 24.06.2022
| Datum | Mittelwert [cm] | Maximum [cm] | Minimum [cm] |
|---|---|---|---|
| 24.06.2022 | 56 | 69 | 35 |
| 23.06.2022 | 61 | 66 | 57 |
| 22.06.2022 | 62 | 68 | 54 |
| 21.06.2022 | 61 | 66 | 55 |
| 20.06.2022 | 59 | 66 | 35 |
| 19.06.2022 | 63 | 69 | 61 |
| 18.06.2022 | 63 | 64 | 61 |
© Bayerisches Landesamt für Umwelt 2024