
- Startseite >
- Flüsse >
- Wasserstand >
- Untere Donau >
- Parsberg >
- Jahresgrafik

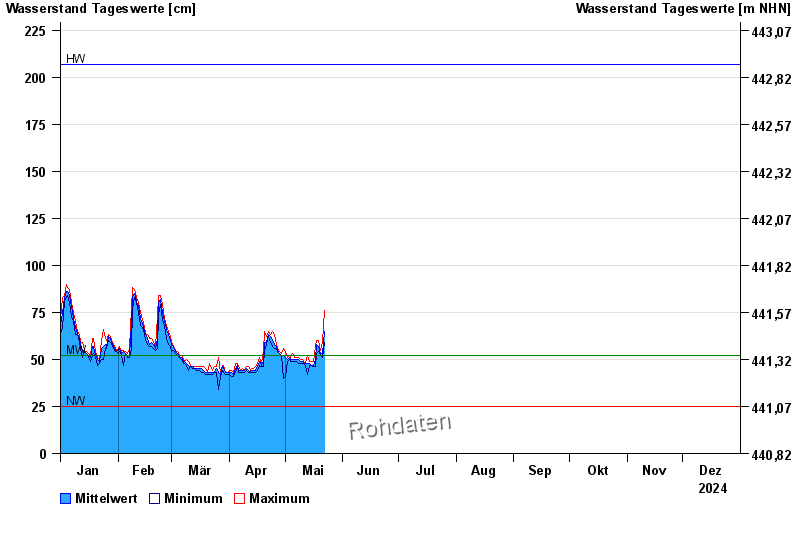
Jahresgrafik Parsberg / Schwarze Laber
Wasserstand vom 01.01.2024 bis zum 31.12.2024
| Datum | Mittelwert [cm] | Maximum [cm] | Minimum [cm] |
|---|---|---|---|
| 18.06.2024 | 61 | 61 | 61 |
| 17.06.2024 | 62 | 64 | 57 |
| 16.06.2024 | 64 | 65 | 62 |
| 15.06.2024 | 65 | 66 | 65 |
| 14.06.2024 | 66 | 68 | 66 |
| 13.06.2024 | 68 | 71 | 66 |
| 12.06.2024 | 69 | 70 | 68 |
© Bayerisches Landesamt für Umwelt 2024