
- Startseite >
- Flüsse >
- Wasserstand >
- Untere Donau >
- Münchshofen >
- Jahresgrafik

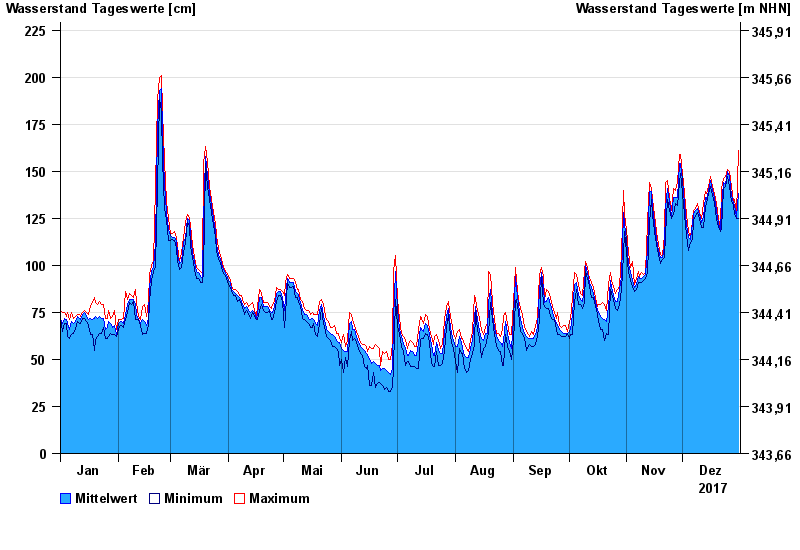
Jahresgrafik Münchshofen / Naab
Wasserstand vom 01.01.2017 bis zum 31.12.2017
- 15.01.2011 Wasserstand: 396 cm
- 27.03.1988 Wasserstand: 387 cm
- 27.01.1995 Wasserstand: 385 cm
- 04.01.2003 Wasserstand: 381 cm
- 24.02.1970 Wasserstand: 363 cm
| Datum | Mittelwert [cm] | Maximum [cm] | Minimum [cm] |
|---|---|---|---|
| 31.12.2017 | 138 | 161 | 125 |
| 30.12.2017 | 126 | 127 | 125 |
| 29.12.2017 | 132 | 135 | 127 |
| 28.12.2017 | 133 | 134 | 132 |
| 27.12.2017 | 137 | 142 | 134 |
| 26.12.2017 | 147 | 150 | 142 |
| 25.12.2017 | 150 | 151 | 147 |
© Bayerisches Landesamt für Umwelt 2024