
- Startseite >
- Flüsse >
- Wasserstand >
- Untere Donau >
- Marienthal >
- Jahresgrafik

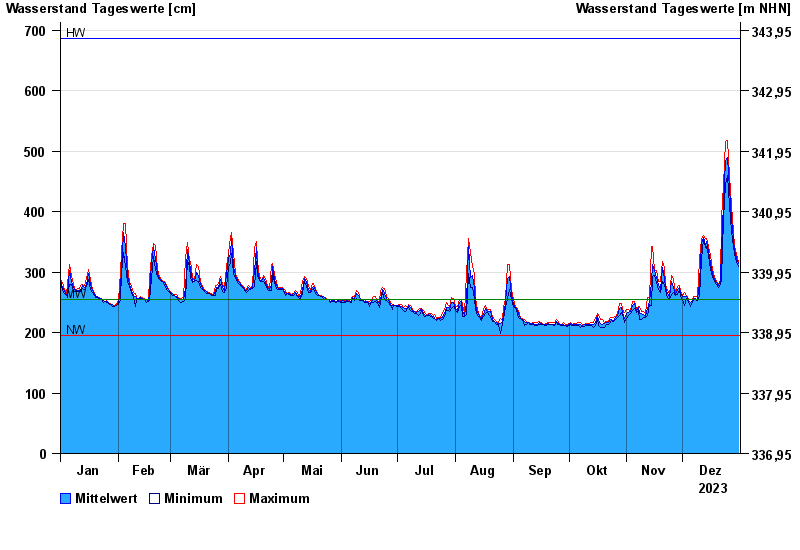
Jahresgrafik Marienthal / Regen
Wasserstand vom 01.01.2023 bis zum 31.12.2023
| Datum | Mittelwert [cm] | Maximum [cm] | Minimum [cm] |
|---|---|---|---|
| 31.12.2023 | 314 | 318 | 310 |
| 30.12.2023 | 323 | 329 | 318 |
| 29.12.2023 | 335 | 343 | 329 |
| 28.12.2023 | 354 | 367 | 343 |
| 27.12.2023 | 387 | 410 | 367 |
| 26.12.2023 | 439 | 459 | 410 |
| 25.12.2023 | 490 | 518 | 459 |
© Bayerisches Landesamt für Umwelt 2024