
- Startseite >
- Flüsse >
- Wasserstand >
- Untere Donau >
- Landshut Birket >
- Jahresgrafik

Jahresgrafik Landshut Birket / Isar
Wasserstand vom 30.03.2024 bis zum 29.03.2025
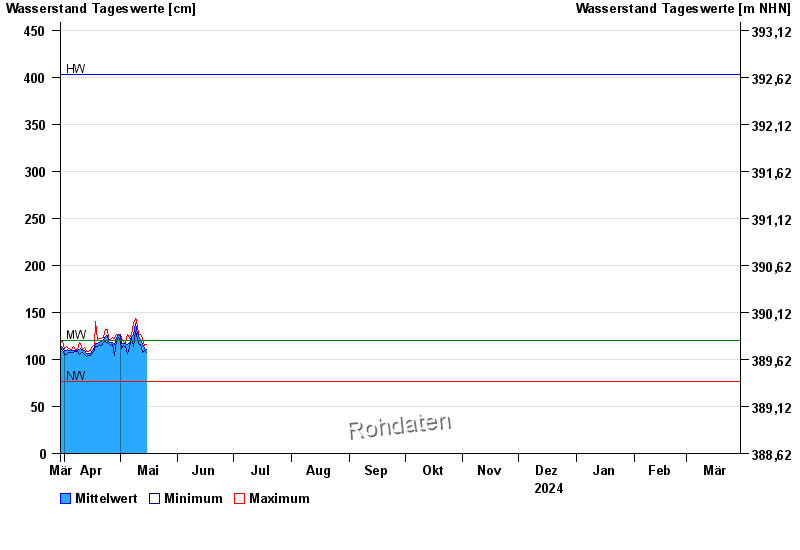
| Datum | Mittelwert [cm] | Maximum [cm] | Minimum [cm] |
|---|---|---|---|
| 16.05.2024 | 112 | 114 | 105 |
| 15.05.2024 | 112 | 118 | 106 |
| 14.05.2024 | 112 | 115 | 110 |
| 13.05.2024 | 116 | 122 | 107 |
| 12.05.2024 | 120 | 126 | 116 |
| 11.05.2024 | 125 | 128 | 117 |
| 10.05.2024 | 132 | 141 | 126 |
© Bayerisches Landesamt für Umwelt 2024