
- Startseite >
- Flüsse >
- Wasserstand >
- Untere Donau >
- Landau >
- Jahresgrafik

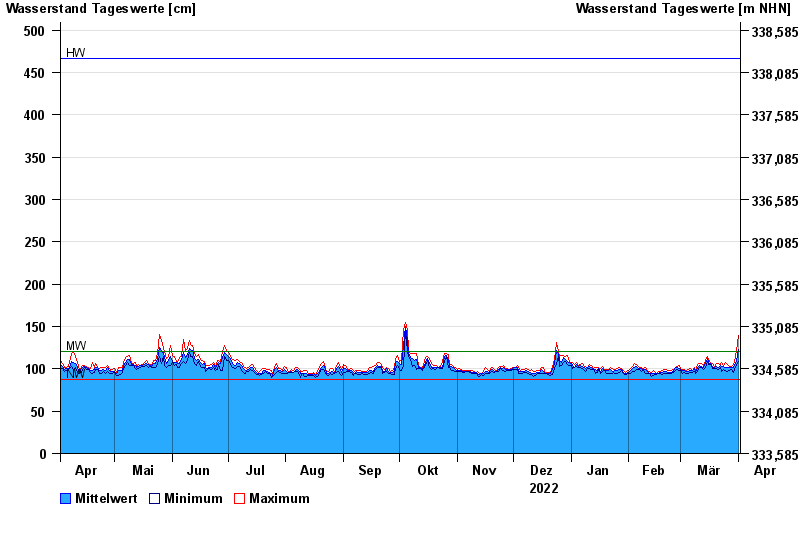
Jahresgrafik Landau / Isar
Wasserstand vom 02.04.2022 bis zum 01.04.2023
| Datum | Mittelwert [cm] | Maximum [cm] | Minimum [cm] |
|---|---|---|---|
| 01.04.2023 | 123 | 139 | 109 |
| 31.03.2023 | 110 | 122 | 105 |
| 30.03.2023 | 104 | 108 | 99 |
| 29.03.2023 | 102 | 105 | 96 |
| 28.03.2023 | 101 | 103 | 99 |
| 27.03.2023 | 101 | 103 | 98 |
| 26.03.2023 | 101 | 105 | 97 |
© Bayerisches Landesamt für Umwelt 2024