
- Startseite >
- Flüsse >
- Wasserstand >
- Untere Donau >
- Kothmaißling >
- Jahresgrafik

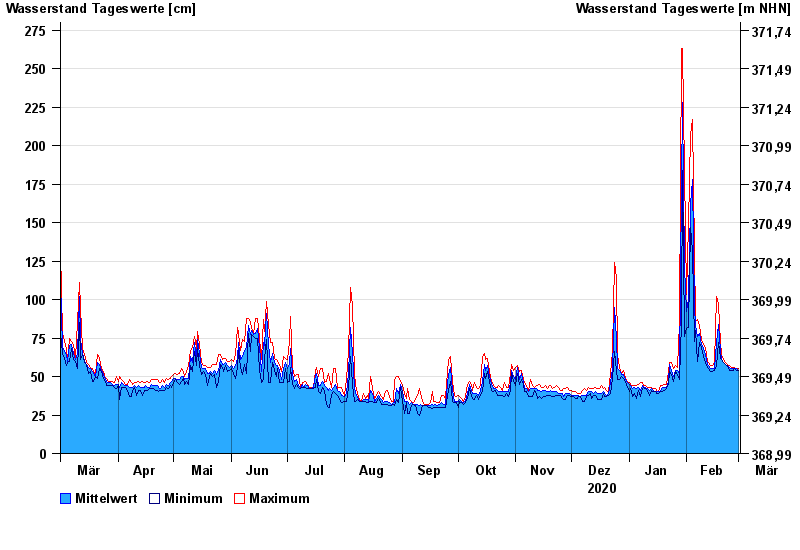
Jahresgrafik Kothmaißling / Chamb
Wasserstand vom 01.03.2020 bis zum 01.03.2021
 Für diesen Pegel sind keine Hochwassermarken hinterlegt.
Hinweis
Beeinflussung durch Buhneneinbau unterhalb vom Pegel
| Datum | Mittelwert [cm] | Maximum [cm] | Minimum [cm] |
|---|---|---|---|
| 01.03.2021 | 54 | 55 | 54 |
| 28.02.2021 | 55 | 55 | 54 |
| 27.02.2021 | 55 | 56 | 55 |
| 26.02.2021 | 55 | 56 | 54 |
| 25.02.2021 | 55 | 56 | 54 |
| 24.02.2021 | 56 | 57 | 54 |
| 23.02.2021 | 57 | 58 | 57 |
© Bayerisches Landesamt für Umwelt 2024