
- Startseite >
- Flüsse >
- Wasserstand >
- Untere Donau >
- Kothmaißling >
- Jahresgrafik

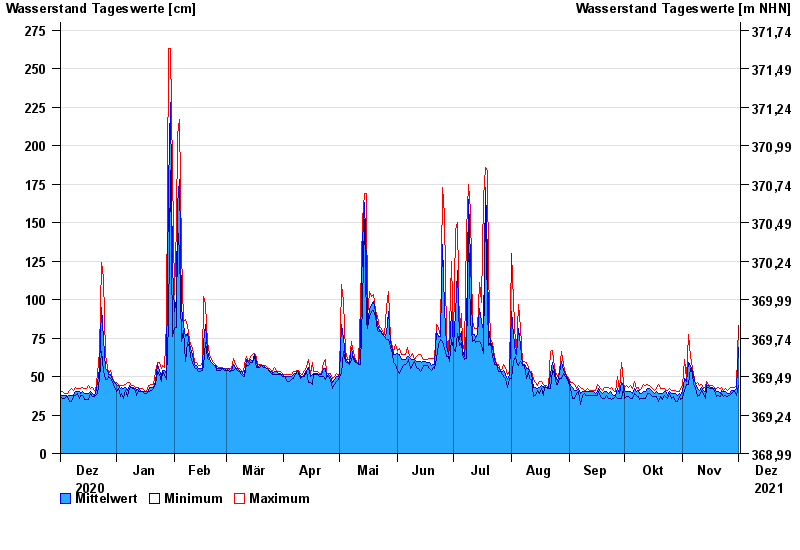
Jahresgrafik Kothmaißling / Chamb
Wasserstand vom 02.12.2020 bis zum 01.12.2021
 Für diesen Pegel sind keine Hochwassermarken hinterlegt.
Hinweis
Beeinflussung durch Buhneneinbau unterhalb vom Pegel
| Datum | Mittelwert [cm] | Maximum [cm] | Minimum [cm] |
|---|---|---|---|
| 01.12.2021 | 69 | 83 | 44 |
| 30.11.2021 | 42 | 44 | 38 |
| 29.11.2021 | 41 | 43 | 40 |
| 28.11.2021 | 41 | 43 | 40 |
| 27.11.2021 | 41 | 43 | 39 |
| 26.11.2021 | 39 | 42 | 38 |
| 25.11.2021 | 39 | 41 | 37 |
© Bayerisches Landesamt für Umwelt 2024