
- Startseite >
- Flüsse >
- Wasserstand >
- Untere Donau >
- Kirchberg >
- Jahresgrafik

Jahresgrafik Kirchberg / Mertseebach
Wasserstand vom 29.03.2024 bis zum 28.03.2025
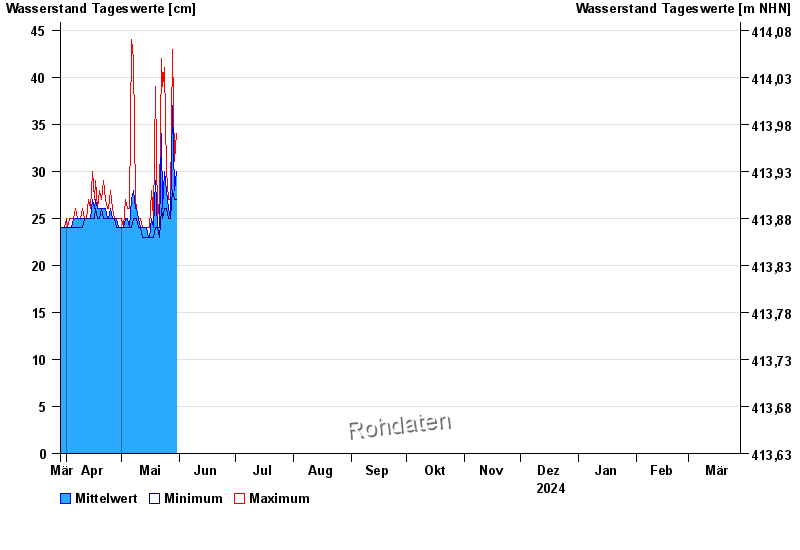
- Hochwassergefahrenfläche HQ100 200 cm
| Datum | Mittelwert [cm] | Maximum [cm] | Minimum [cm] |
|---|---|---|---|
| 09.05.2024 | 26 | 26 | 25 |
| 08.05.2024 | 26 | 27 | 25 |
| 07.05.2024 | 28 | 42 | 25 |
| 06.05.2024 | 27 | 44 | 24 |
| 05.05.2024 | 24 | 26 | 24 |
| 04.05.2024 | 25 | 26 | 24 |
| 03.05.2024 | 25 | 27 | 24 |
© Bayerisches Landesamt für Umwelt 2024