
- Startseite >
- Flüsse >
- Wasserstand >
- Untere Donau >
- Kelheim >
- Jahresgrafik

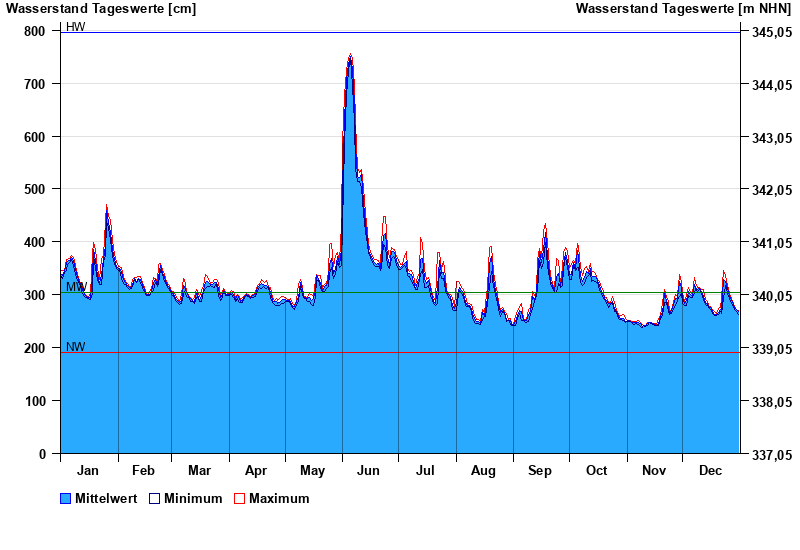
Jahresgrafik Kelheim / Donau
Wasserstand vom 01.01.2024 bis zum 31.12.2024
| Datum | Mittelwert [cm] | Maximum [cm] | Minimum [cm] |
|---|---|---|---|
| 18.06.2024 | 361 | 364 | 356 |
| 17.06.2024 | 366 | 373 | 361 |
| 16.06.2024 | 375 | 381 | 371 |
| 15.06.2024 | 384 | 395 | 378 |
| 14.06.2024 | 407 | 420 | 396 |
| 13.06.2024 | 434 | 453 | 419 |
| 12.06.2024 | 475 | 503 | 454 |
© Bayerisches Landesamt für Umwelt 2024