
- Startseite >
- Flüsse >
- Wasserstand >
- Untere Donau >
- Grafenmühle >
- Jahresgrafik

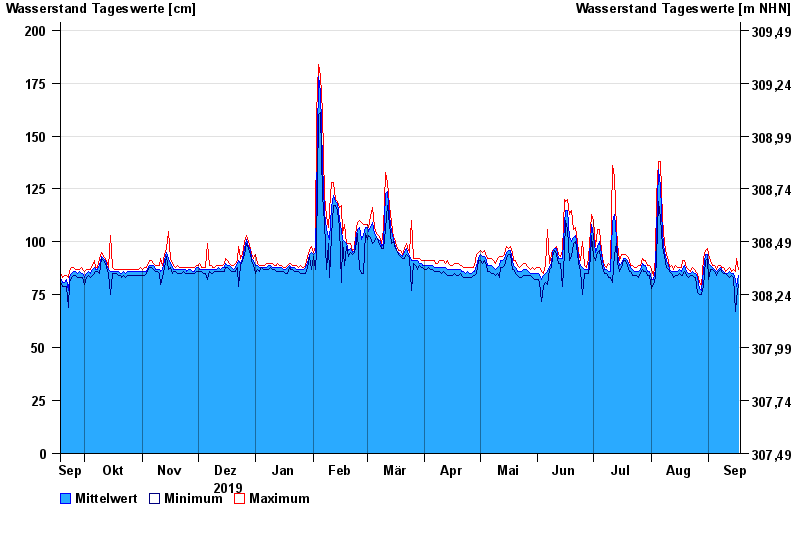
Jahresgrafik Grafenmühle / Vils
Wasserstand vom 18.09.2019 bis zum 17.09.2020
- 23.02.1970 Wasserstand: 537 cm
- 14.01.2011 Wasserstand: 496 cm
- 03.06.2013 Wasserstand: 462 cm
- 14.01.2004 Wasserstand: 439 cm
- 03.08.1991 Wasserstand: 435 cm
| Datum | Mittelwert [cm] | Maximum [cm] | Minimum [cm] |
|---|---|---|---|
| 17.09.2020 | 84 | 87 | 80 |
| 16.09.2020 | 79 | 92 | 73 |
| 15.09.2020 | 82 | 86 | 67 |
| 14.09.2020 | 85 | 87 | 83 |
| 13.09.2020 | 85 | 86 | 84 |
| 12.09.2020 | 86 | 88 | 83 |
| 11.09.2020 | 85 | 87 | 84 |
© Bayerisches Landesamt für Umwelt 2024