
- Startseite >
- Flüsse >
- Wasserstand >
- Untere Donau >
- Grafenau >
- Jahresgrafik

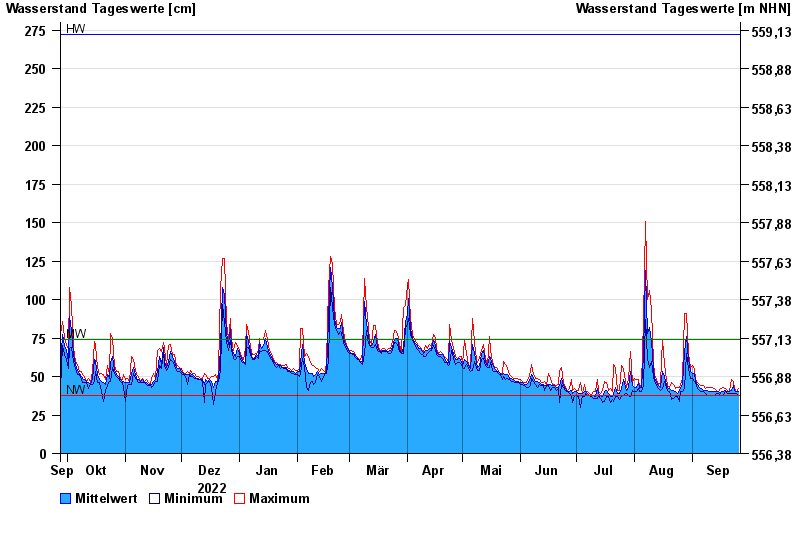
Jahresgrafik Grafenau / Kleine Ohe
Wasserstand vom 27.09.2022 bis zum 26.09.2023
| Datum | Mittelwert [cm] | Maximum [cm] | Minimum [cm] |
|---|---|---|---|
| 26.09.2023 | 40 | 42 | 38 |
| 25.09.2023 | 40 | 40 | 39 |
| 24.09.2023 | 41 | 42 | 39 |
| 23.09.2023 | 44 | 47 | 39 |
| 22.09.2023 | 41 | 48 | 39 |
| 21.09.2023 | 40 | 40 | 39 |
| 20.09.2023 | 40 | 41 | 39 |
© Bayerisches Landesamt für Umwelt 2024