
- Startseite >
- Flüsse >
- Wasserstand >
- Untere Donau >
- Grafenau >
- Jahresgrafik

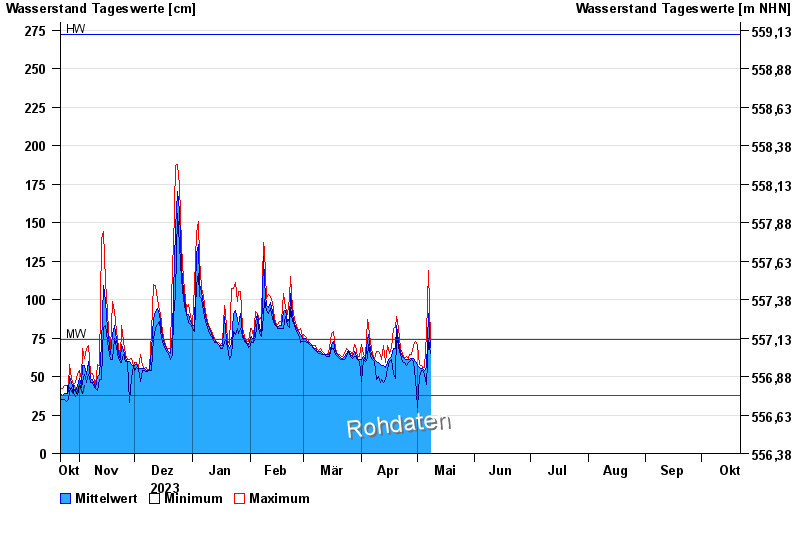
Jahresgrafik Grafenau / Kleine Ohe
Wasserstand vom 22.10.2023 bis zum 21.10.2024
| Datum | Mittelwert [cm] | Maximum [cm] | Minimum [cm] |
|---|---|---|---|
| 05.05.2024 | 54 | 56 | 51 |
| 04.05.2024 | 55 | 56 | 54 |
| 03.05.2024 | 55 | 57 | 54 |
| 02.05.2024 | 56 | 58 | 50 |
| 01.05.2024 | 57 | 70 | 30 |
| 30.04.2024 | 60 | 73 | 48 |
| 29.04.2024 | 62 | 70 | 60 |
© Bayerisches Landesamt für Umwelt 2024