
- Startseite >
- Flüsse >
- Wasserstand >
- Untere Donau >
- Grafenau >
- Jahresgrafik

Jahresgrafik Grafenau / Kleine Ohe
Wasserstand vom 06.12.2020 bis zum 05.12.2021
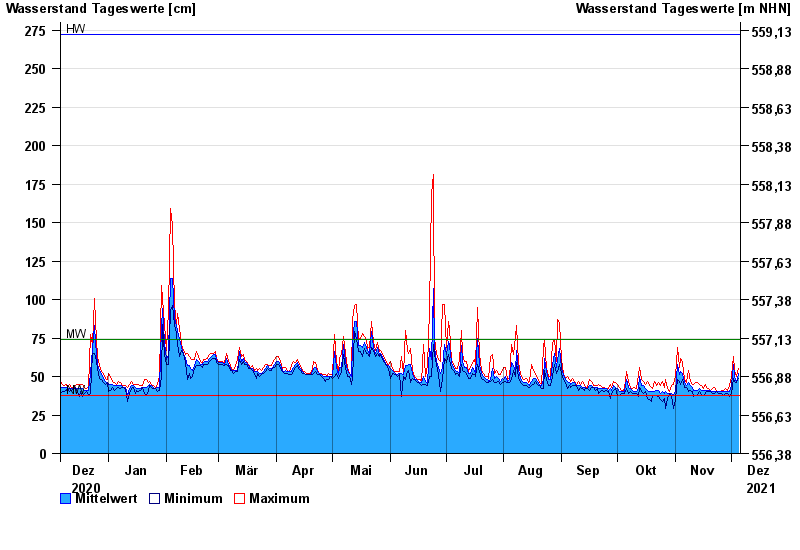
| Datum | Mittelwert [cm] | Maximum [cm] | Minimum [cm] |
|---|---|---|---|
| 05.12.2021 | 52 | 55 | 49 |
| 04.12.2021 | 46 | 50 | 46 |
| 03.12.2021 | 50 | 54 | 47 |
| 02.12.2021 | 58 | 63 | 49 |
| 01.12.2021 | 44 | 50 | 39 |
| 30.11.2021 | 40 | 44 | 37 |
| 29.11.2021 | 40 | 41 | 39 |
© Bayerisches Landesamt für Umwelt 2024