
- Startseite >
- Flüsse >
- Wasserstand >
- Untere Donau >
- Grafenau >
- Jahresgrafik

Jahresgrafik Grafenau / Kleine Ohe
Wasserstand vom 02.08.2023 bis zum 01.08.2024
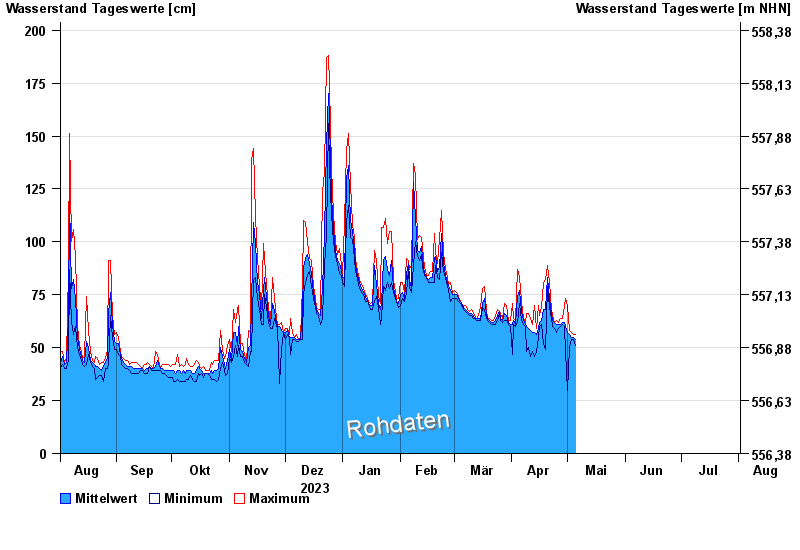
- Hochwassergefahrenfläche HQ100 270 cm
| Datum | Mittelwert [cm] | Maximum [cm] | Minimum [cm] |
|---|---|---|---|
| 09.05.2024 | 61 | 63 | 59 |
| 08.05.2024 | 67 | 74 | 63 |
| 07.05.2024 | 91 | 119 | 75 |
| 06.05.2024 | 56 | 78 | 45 |
| 05.05.2024 | 54 | 56 | 51 |
| 04.05.2024 | 55 | 56 | 54 |
| 03.05.2024 | 55 | 57 | 54 |
© Bayerisches Landesamt für Umwelt 2024