
- Startseite >
- Flüsse >
- Wasserstand >
- Untere Donau >
- Grafenau >
- Jahresgrafik

Jahresgrafik Grafenau / Kleine Ohe
Wasserstand vom 14.06.2022 bis zum 13.06.2023
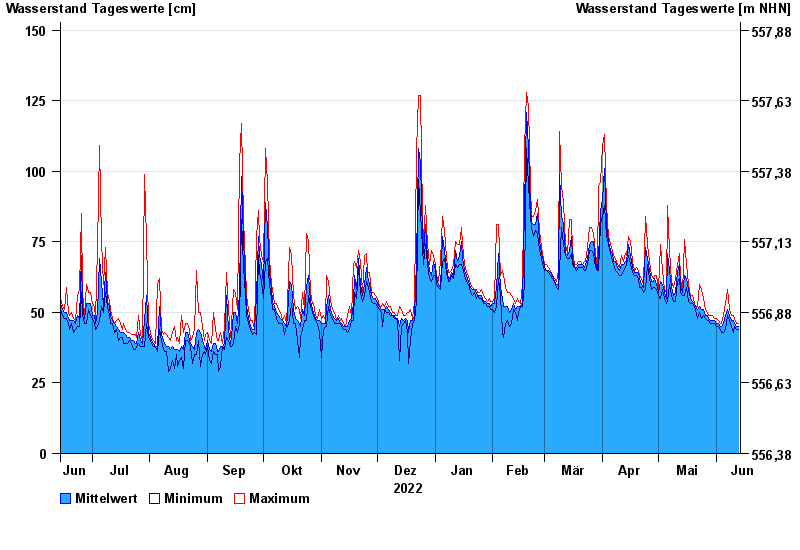
| Datum | Mittelwert [cm] | Maximum [cm] | Minimum [cm] |
|---|---|---|---|
| 13.06.2023 | 45 | 46 | 44 |
| 12.06.2023 | 45 | 46 | 44 |
| 11.06.2023 | 46 | 48 | 45 |
| 10.06.2023 | 47 | 49 | 43 |
| 09.06.2023 | 47 | 49 | 45 |
| 08.06.2023 | 49 | 51 | 47 |
| 07.06.2023 | 51 | 58 | 49 |
© Bayerisches Landesamt für Umwelt 2024