
- Startseite >
- Flüsse >
- Wasserstand >
- Untere Donau >
- Freising >
- Jahresgrafik

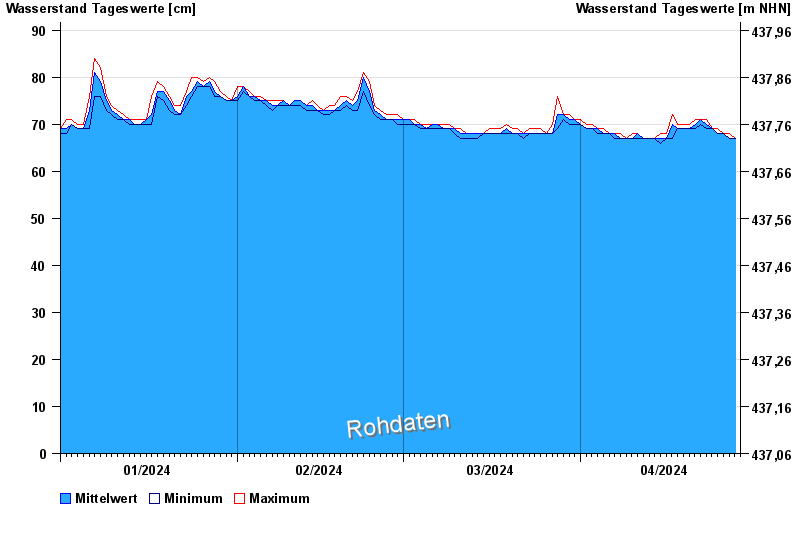
Jahresgrafik Freising / Moosach
Wasserstand vom 01.01.2024 bis zum 28.04.2024
 Für diesen Pegel sind keine Hochwassermarken hinterlegt.
| Datum | Mittelwert [cm] | Maximum [cm] | Minimum [cm] |
|---|---|---|---|
| 28.04.2024 | 67 | 67 | 67 |
| 27.04.2024 | 67 | 68 | 67 |
| 26.04.2024 | 68 | 68 | 68 |
| 25.04.2024 | 68 | 69 | 68 |
| 24.04.2024 | 69 | 69 | 69 |
| 23.04.2024 | 70 | 71 | 69 |
| 22.04.2024 | 71 | 71 | 70 |
© Bayerisches Landesamt für Umwelt 2024