
- Startseite >
- Flüsse >
- Wasserstand >
- Untere Donau >
- Eggenfelden >
- Jahresgrafik

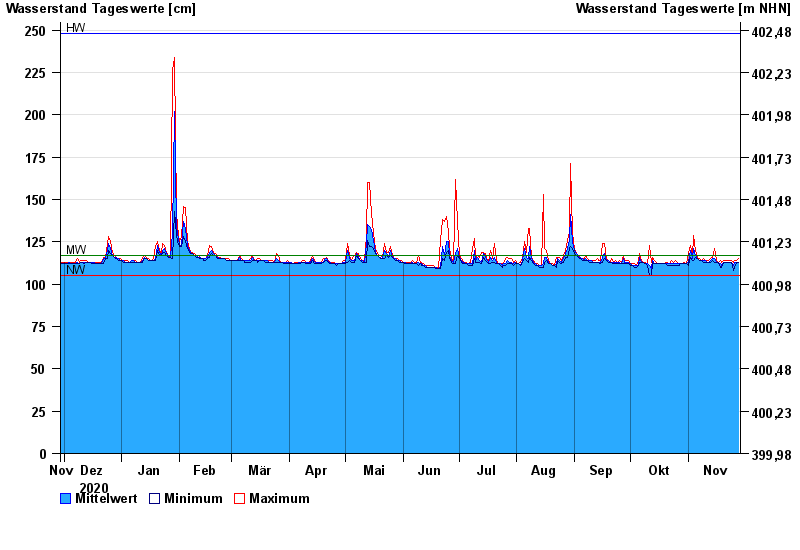
Jahresgrafik Eggenfelden / Mertseebach
Wasserstand vom 29.11.2020 bis zum 28.11.2021
| Datum | Mittelwert [cm] | Maximum [cm] | Minimum [cm] |
|---|---|---|---|
| 28.11.2021 | 113 | 115 | 113 |
| 27.11.2021 | 113 | 114 | 113 |
| 26.11.2021 | 113 | 114 | 110 |
| 25.11.2021 | 111 | 113 | 108 |
| 24.11.2021 | 113 | 114 | 113 |
| 23.11.2021 | 113 | 114 | 113 |
| 22.11.2021 | 113 | 114 | 113 |
© Bayerisches Landesamt für Umwelt 2024