
- Startseite >
- Flüsse >
- Wasserstand >
- Untere Donau >
- Eggenfelden >
- Jahresgrafik

Jahresgrafik Eggenfelden / Mertseebach
Wasserstand vom 21.08.2019 bis zum 20.08.2020
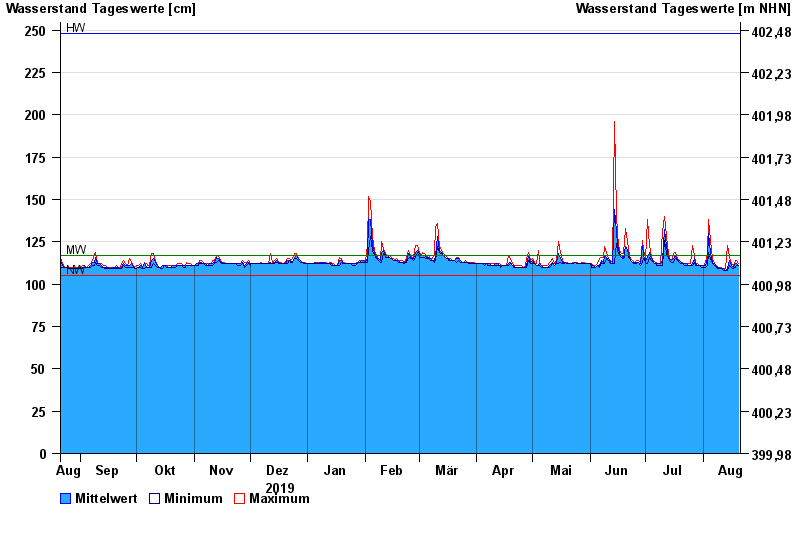
| Datum | Mittelwert [cm] | Maximum [cm] | Minimum [cm] |
|---|---|---|---|
| 20.08.2020 | 111 | 112 | 111 |
| 19.08.2020 | 112 | 114 | 111 |
| 18.08.2020 | 112 | 114 | 110 |
| 17.08.2020 | 110 | 111 | 109 |
| 16.08.2020 | 111 | 112 | 110 |
| 15.08.2020 | 114 | 116 | 111 |
| 14.08.2020 | 109 | 123 | 108 |
© Bayerisches Landesamt für Umwelt 2024