
- Startseite >
- Flüsse >
- Wasserstand >
- Untere Donau >
- Eggenfelden >
- Jahresgrafik

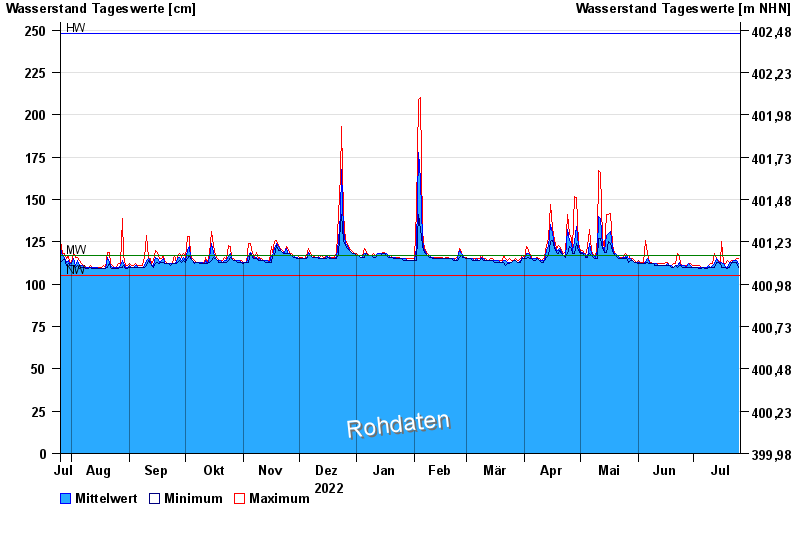
Jahresgrafik Eggenfelden / Mertseebach
Wasserstand vom 26.07.2022 bis zum 25.07.2023
| Datum | Mittelwert [cm] | Maximum [cm] | Minimum [cm] |
|---|---|---|---|
| 25.07.2023 | 112 | 115 | 110 |
| 24.07.2023 | 114 | 115 | 113 |
| 23.07.2023 | 114 | 114 | 113 |
| 22.07.2023 | 114 | 114 | 113 |
| 21.07.2023 | 113 | 114 | 113 |
| 20.07.2023 | 113 | 113 | 110 |
| 19.07.2023 | 110 | 114 | 109 |
© Bayerisches Landesamt für Umwelt 2024