
- Startseite >
- Flüsse >
- Wasserstand >
- Untere Donau >
- Cham >
- Jahresgrafik

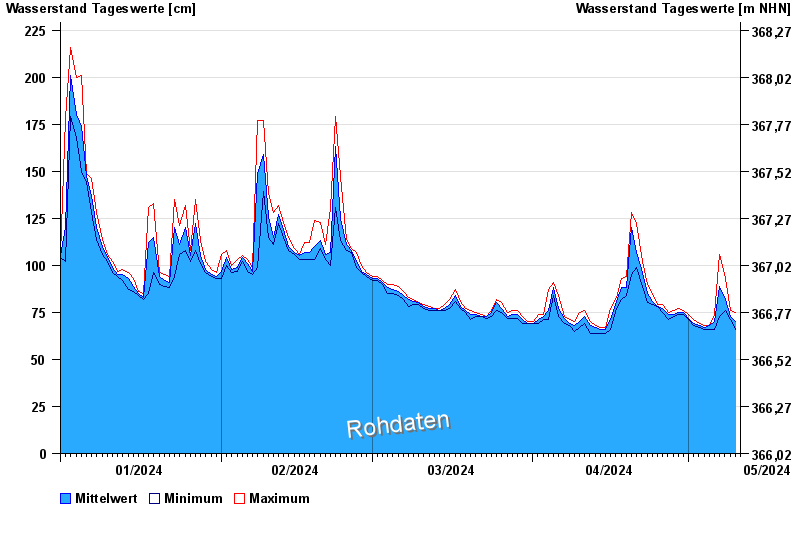
Jahresgrafik Cham / Regen
Wasserstand vom 01.01.2024 bis zum 10.05.2024
| Datum | Mittelwert [cm] | Maximum [cm] | Minimum [cm] |
|---|---|---|---|
| 10.05.2024 | 72 | 75 | 70 |
| 09.05.2024 | 73 | 76 | 71 |
| 08.05.2024 | 82 | 93 | 76 |
| 07.05.2024 | 89 | 106 | 73 |
| 06.05.2024 | 70 | 74 | 66 |
| 05.05.2024 | 68 | 68 | 66 |
| 04.05.2024 | 67 | 68 | 66 |
© Bayerisches Landesamt für Umwelt 2024