
- Startseite >
- Flüsse >
- Wasserstand >
- Naab - Regen >
- Weiden >
- Jahresgrafik

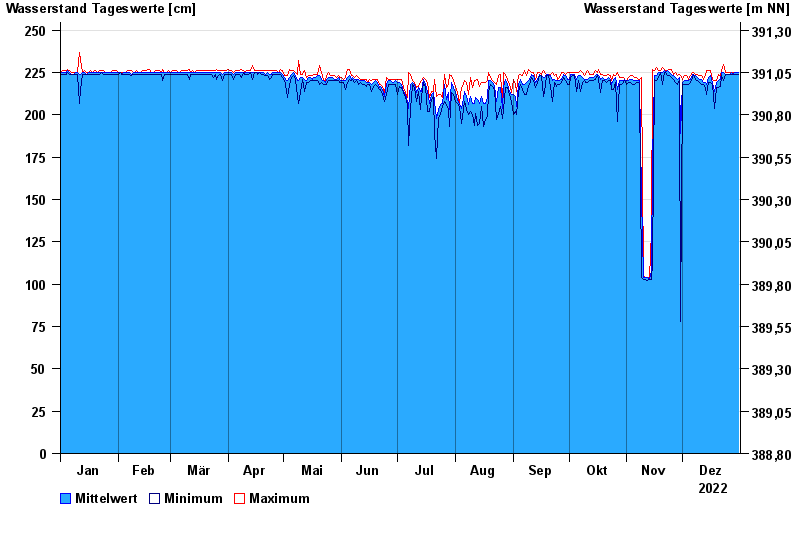
Jahresgrafik Weiden / Waldnaab
Wasserstand vom 01.01.2022 bis zum 31.12.2022
 Für diesen Pegel sind keine historische Ereignisse hinterlegt.
| Datum | Mittelwert [cm] | Maximum [cm] | Minimum [cm] |
|---|---|---|---|
| 31.12.2022 | 225 | 225 | 224 |
| 30.12.2022 | 225 | 225 | 224 |
| 29.12.2022 | 225 | 225 | 224 |
| 28.12.2022 | 224 | 225 | 224 |
| 27.12.2022 | 225 | 225 | 224 |
| 26.12.2022 | 224 | 225 | 224 |
| 25.12.2022 | 224 | 225 | 224 |
© Bayerisches Landesamt für Umwelt 2024