
- Startseite >
- Flüsse >
- Wasserstand >
- Naab - Regen >
- Untersteinach >
- Jahresgrafik

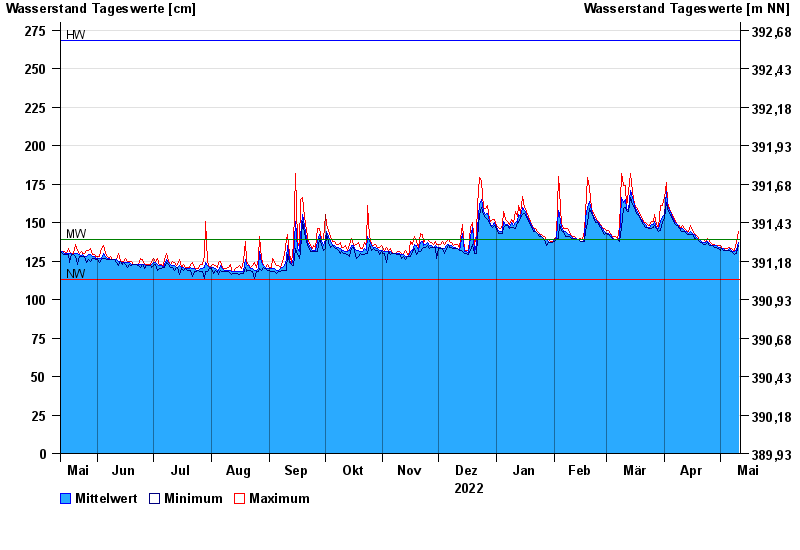
Jahresgrafik Untersteinach / Warme Steinach
Wasserstand vom 12.05.2022 bis zum 11.05.2023
| Datum | Mittelwert [cm] | Maximum [cm] | Minimum [cm] |
|---|---|---|---|
| 11.05.2023 | 137 | 144 | 135 |
| 10.05.2023 | 132 | 137 | 130 |
| 09.05.2023 | 131 | 132 | 129 |
| 08.05.2023 | 131 | 132 | 130 |
| 07.05.2023 | 132 | 133 | 131 |
| 06.05.2023 | 133 | 134 | 132 |
| 05.05.2023 | 132 | 133 | 132 |
© Bayerisches Landesamt für Umwelt 2024