
- Startseite >
- Flüsse >
- Wasserstand >
- Naab - Regen >
- Schwandorf >
- Jahresgrafik

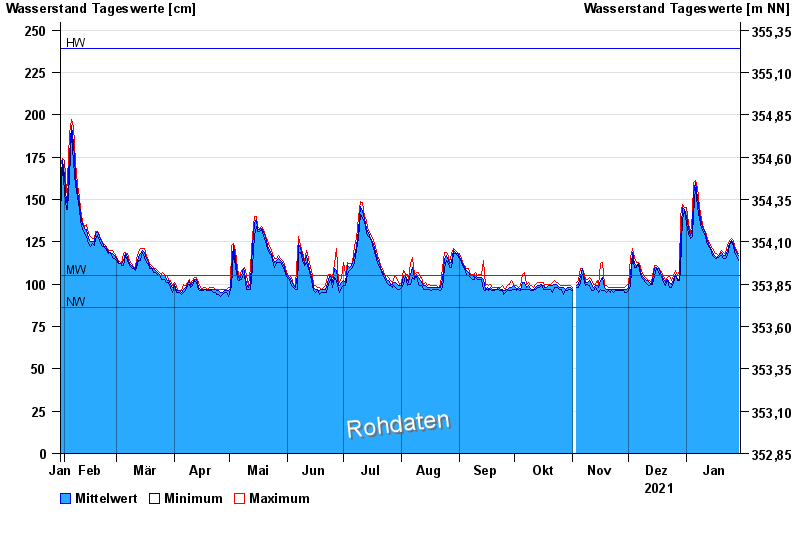
Jahresgrafik Schwandorf / Naab
Wasserstand vom 30.01.2021 bis zum 29.01.2022
Hinweis
Pegel bis auf Weiteres außer Betrieb wegen Brückenbauarbeiten.
| Datum | Mittelwert [cm] | Maximum [cm] | Minimum [cm] |
|---|---|---|---|
| 29.01.2022 | 117 | 118 | 114 |
| 28.01.2022 | 119 | 120 | 117 |
| 27.01.2022 | 121 | 123 | 119 |
| 26.01.2022 | 124 | 126 | 122 |
| 25.01.2022 | 126 | 127 | 125 |
| 24.01.2022 | 124 | 126 | 123 |
| 23.01.2022 | 120 | 123 | 117 |
© Bayerisches Landesamt für Umwelt 2024