
- Startseite >
- Flüsse >
- Wasserstand >
- Naab - Regen >
- Schwandorf >
- Jahresgrafik

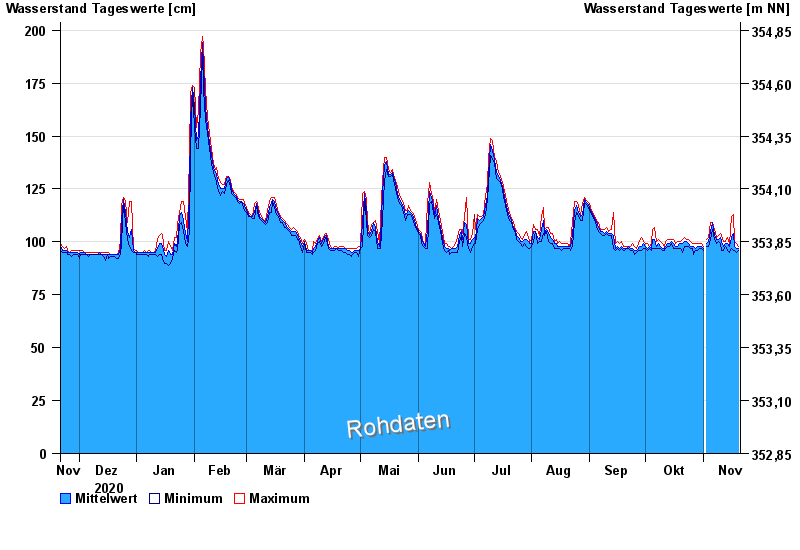
Jahresgrafik Schwandorf / Naab
Wasserstand vom 21.11.2020 bis zum 20.11.2021
Hinweis
Pegel bis auf Weiteres außer Betrieb wegen Brückenbauarbeiten.
| Datum | Mittelwert [cm] | Maximum [cm] | Minimum [cm] |
|---|---|---|---|
| 20.11.2021 | 97 | 98 | 96 |
| 19.11.2021 | 97 | 99 | 95 |
| 18.11.2021 | 98 | 100 | 96 |
| 17.11.2021 | 104 | 113 | 96 |
| 16.11.2021 | 102 | 112 | 97 |
| 15.11.2021 | 98 | 99 | 95 |
| 14.11.2021 | 99 | 102 | 96 |
© Bayerisches Landesamt für Umwelt 2024