
- Startseite >
- Flüsse >
- Wasserstand >
- Naab - Regen >
- Schwandorf >
- Jahresgrafik

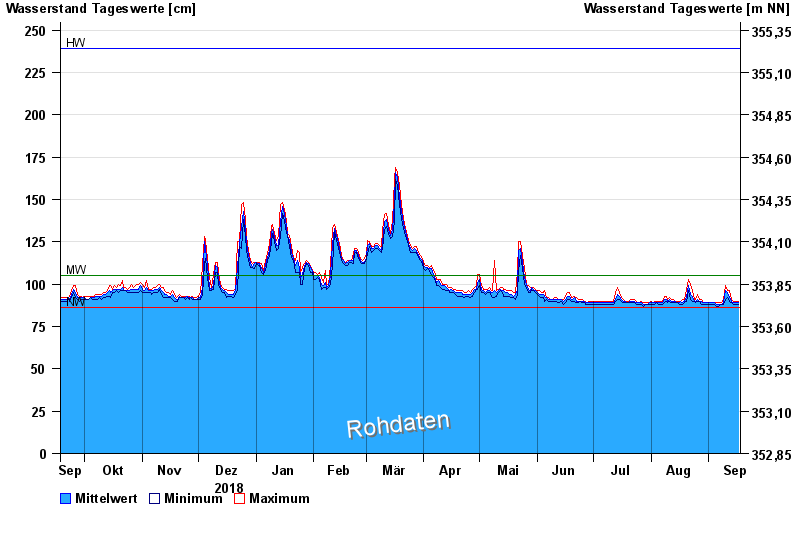
Jahresgrafik Schwandorf / Naab
Wasserstand vom 18.09.2018 bis zum 17.09.2019
Hinweis
Pegel bis auf Weiteres außer Betrieb wegen Brückenbauarbeiten.
| Datum | Mittelwert [cm] | Maximum [cm] | Minimum [cm] |
|---|---|---|---|
| 17.09.2019 | 89 | 90 | 88 |
| 16.09.2019 | 89 | 90 | 88 |
| 15.09.2019 | 89 | 90 | 88 |
| 14.09.2019 | 89 | 90 | 88 |
| 13.09.2019 | 90 | 91 | 89 |
| 12.09.2019 | 92 | 96 | 90 |
| 11.09.2019 | 95 | 96 | 92 |
© Bayerisches Landesamt für Umwelt 2024